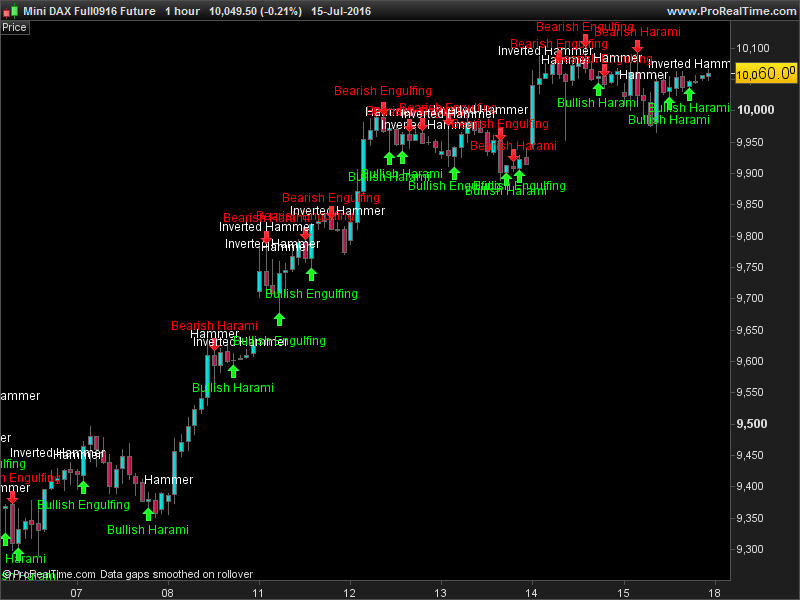
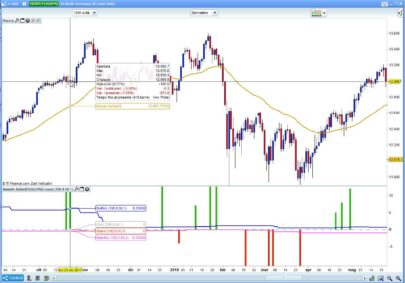
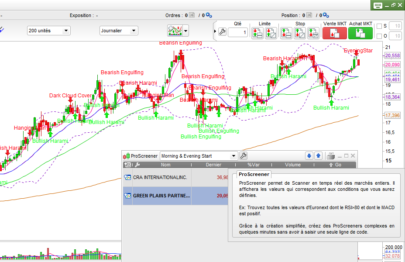
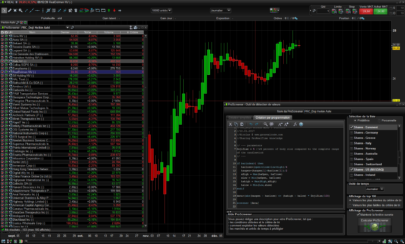
This indicator recognize about 13 candlestick patterns and draw their names with green and red arrows on chart:
- Doji
- Evening star
- Morning star
- Shooting star
- Hammer
- Inverted hammer
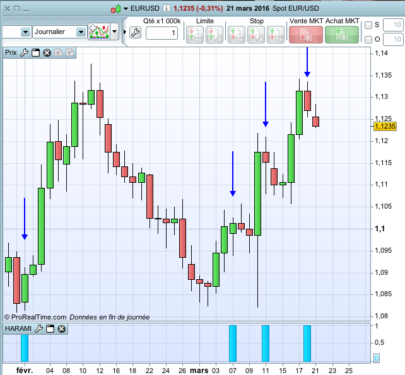
- Bearish harami
- Bullish harami
- Bearish engulfing
- Bullish engulfing
- Piercing line
- Hanging man
- Dark cloud cover
I know a lot of people are looking for codes for candlestick pattern recognition, I stumble upon this pinescript code at TV so I decided to convert it to prorealtime.
The patterns tests are stored into “data” variables, so these codes snippets can be taken to make other indicators, trading strategies or screeners with ease.
Text colour can be changed with the R.G.B. values at the beginning of the code.
|
1 2 3 4 5 6 7 8 9 10 11 12 13 14 15 16 17 18 19 20 21 22 23 24 25 26 27 28 29 30 31 32 33 34 35 36 37 38 39 40 41 42 43 44 45 46 47 48 49 50 51 52 53 54 55 56 57 58 59 60 61 62 63 64 65 66 67 68 69 70 71 72 73 74 75 76 77 78 79 80 81 82 83 84 85 |
//text color // white = 255,255,255 ; black = 0,0,0 r = 255 g = 255 b = 255 atr = averagetruerange[10](close)*0.5 DojiSize = 0.05 data=(abs(open - close) <= (high - low) * DojiSize) if data then DRAWTEXT("Doji", barindex, high+atr, Dialog, Standard, 12) COLOURED(R,G,B) endif data2=(close[2] > open[2] and min(open[1], close[1]) > close[2] and open < min(open[1], close[1]) and close < open ) if data2 then DRAWTEXT("Evening Star", barindex, high[1]+atr*1.5, Dialog, Standard, 12) COLOURED(255,0,10) DRAWARROWDOWN(barindex-1,high[1]) COLOURED(255,0,10) endif data3=(close[2] < open[2] and max(open[1], close[1]) < close[2] and open > max(open[1], close[1]) and close > open ) if data3 then DRAWTEXT("Morning Star", barindex, low[1]-atr*1.5, Dialog, Standard, 12) COLOURED(0,255,10) DRAWARROWUP(barindex-1,low[1]) COLOURED(0,255,10) endif data4=(open[1] < close[1] and open > close[1] and high - max(open, close) >= abs(open - close) * 3 and min(close, open) - low <= abs(open - close)) if data4 then DRAWTEXT("Shooting Star", barindex, high+atr*1.5, Dialog, Standard, 12) COLOURED(255,0,10) DRAWARROWDOWN(barindex,high) COLOURED(255,0,10) endif data5=(((high - low)>3*(open -close)) and ((close - low)/(.001 + high - low) > 0.6) and ((open - low)/(.001 + high - low) > 0.6)) if data5 then DRAWTEXT("Hammer", barindex, high+atr, Dialog, Standard, 12) COLOURED(R,G,B) endif data5b=(((high - low)>3*(open -close)) and ((high - close)/(.001 + high - low) > 0.6) and ((high - open)/(.001 + high - low) > 0.6)) if data5b then DRAWTEXT("Inverted Hammer", barindex, high+atr, Dialog, Standard, 12) COLOURED(R,G,B) endif data6=(close[1] > open[1] and open > close and open <= close[1] and open[1] <= close and open - close < close[1] - open[1] ) if data6 then DRAWTEXT("Bearish Harami", barindex, high+atr*1.5, Dialog, Standard, 12) COLOURED(255,0,10) DRAWARROWDOWN(barindex,high) COLOURED(255,0,10) endif data7=(open[1] > close[1] and close > open and close <= open[1] and close[1] <= open and close - open < open[1] - close[1] ) if data7 then DRAWTEXT("Bullish Harami", barindex, low-atr*1.5, Dialog, Standard, 12) COLOURED(0,255,10) DRAWARROWUP(barindex,low) COLOURED(0,255,10) endif data8=(close[1] > open[1] and open > close and open >= close[1] and open[1] >= close and open - close > close[1] - open[1] ) if data8 then DRAWTEXT("Bearish Engulfing", barindex, high+atr*1.5, Dialog, Standard, 12) COLOURED(255,0,10) DRAWARROWDOWN(barindex,high) COLOURED(255,0,10) endif data9=(open[1] > close[1] and close > open and close >= open[1] and close[1] >= open and close - open > open[1] - close[1] ) if data9 then DRAWTEXT("Bullish Engulfing", barindex, low-atr*1.5, Dialog, Standard, 12) COLOURED(0,255,10) DRAWARROWUP(barindex,low) COLOURED(0,255,10) endif data10=(close[1] < open[1] and open < low[1] and close > close[1] + ((open[1] - close[1])/2) and close < open[1]) if data10 then DRAWTEXT("Piercing Line", barindex, low-atr*1.5, Dialog, Standard, 12) COLOURED(0,255,10) DRAWARROWUP(barindex,low) COLOURED(0,255,10) endif data14=(((high-low>4*(open-close))and((close-low)/(.001+high-low)>=0.75)and((open-low)/(.001+high-low)>=0.75)) and high[1] < open and high[2] < open) if data14 then DRAWTEXT("Hanging Man", barindex, high+atr*1.5, Dialog, Standard, 12) COLOURED(255,0,10) DRAWARROWDOWN(barindex,high) COLOURED(255,0,10) endif data15=((close[1]>open[1])and(((close[1]+open[1])/2)>close)and(open>close)and(open>close[1])and(close>open[1])and((open-close)/(.001+(high-low))>0.6)) if data15 then DRAWTEXT("Dark Cloud Cover", barindex, high+atr*1.5, Dialog, Standard, 12) COLOURED(255,0,10) DRAWARROWDOWN(barindex,high) COLOURED(255,0,10) endif RETURN |
Share this
No information on this site is investment advice or a solicitation to buy or sell any financial instrument. Past performance is not indicative of future results. Trading may expose you to risk of loss greater than your deposits and is only suitable for experienced investors who have sufficient financial means to bear such risk.
ProRealTime ITF files and other attachments :PRC is also on YouTube, subscribe to our channel for exclusive content and tutorials



Bug on 10.2? Errore di sintassi: Linea 12, carattere 9Uno dei seguenti caratteri sarebbe più appropriato di “(“:– “,”– “=”
This indicator is only compatible with version 10.3, because it draws graphical components.
Ok, i’m waiting for release. Thanks for this sharing, very very interesting.
Nice work !
Very nice !
This has been requested many times by PRT users.
Bonjour Nicolas. Superbe indicateur. Peut-on l’utiliser pour des stratégies ? Visiblement oui mais dans le module backtest, je ne vois apparaître que le nom de l’indicateur lorsque j’essaye de saisir des conditions d’achat / vente …Comme faire ?J’ai la même question avec le Fractal ZigZag, seul le nom de l’indicateur apparaît.
Merci pour tes lumières. Cette version semble très prometteuse.
En effet, puisque tu remarques que la fonction RETURN ne retourne rien comme variable. Dans la version 10.3 on peut se permettre de le faire lorsque on souhaite juste faire des indications graphiques.
Pour utiliser ces patterns dans ton code, il te suffit juste de faire des copier/coller des lignes “data” et de les vérifier comme des conditions banales : IF DATA14>0 THEN ..
ok merci. Je vais tester cela…
how do i get version 10.3??
You can get an access to the beta version at http://www.prorealtime.com
Ça va être très intéressant d’avoir un retour statistique sur ces figures chartistes, merci!
Hello Nicolas and thanks a lot for your excellent work.
I have been trying to use this indicator but, after importing it from PRT version 10.3, nothing happens.
https://gyazo.com/fd22ce752d60add9a7ba091b21ff457e
Please add it on the price chart using the wrench at the left upper side of the chart.
Oh yes! It works.
Thanks a lot Nicolas.
This is soooo good! I’d seen it when I had 10.2 , but forgot until now with 10.3!
Very Big Thanks NicolasGraHal
Bonsoir, comment modifier le texte blanc en une autre couleur, le blanc étant extrèmement difficile à lire?
Un grand bravo pour votre travail.
La définition de la couleur blanche a été volontairement laissé accessible pour modification aux lignes 3,4,5 pour les utilisateurs n’utilisant pas un fond noir pour leurs graphiques (valeurs Rouge, Vert et Bleu à modifier à votre convenance).
There is this Metatrade 4 code that I found around, and it seems more complete than the one posted here
Could someone kindly convert it to Prorealtime code?
Thanks in advance
Please use the forums instead! Don’t copy/paste codes of entire indicator in comments 🙂 You can upload file in a new forum post query for indicator translation.
Great Nicolas and Thx,
Nice work. IG has released today PRT 10,3 in Germany and I added the function immediately.
Another indicator for almost 40 candlesticks patterns identification has been released by Ciccio and it is available here: https://www.prorealcode.com/prorealtime-indicators/candlesticks-patterns-indicator/
Hi Nicolas,
Can this be edited to only show bullish/ bearish engulfing .
Darragh
hello excuse my english, but i didn’t see spinning candle detection ? can you add it please !
You should have a look at this other candlesticks patterns indicator: https://www.prorealcode.com/prorealtime-indicators/candlesticks-patterns-indicator/
Hi Nicolas,
Thanks for the wonderful work? Do you know if there’s a way to say if the candlestick is a hammer and a doji, only write Doji? Because it’s often the same …
Thanks.
Greg
Dear Nicolas,
Thank you very much for your work.
As a beginner, I’m not yet a pro of coding as you are so may I kindly ask for your help? Would it be possible to add the following patterns, too? As per this source (http://thepatternsite.com/CandlePerformers.html), some patterns are more efficient than others. The following 6 ones aren’t included in your code and are claimed to be good: 1/ 3 line strike bearish, 2/ 3 line strike bullish, 3/ 3 black crows, 4/ matching low, 5/ abandoned baby bullish, 6/ breakaway bearish. Thank you sooo much in advance, you are the best!
Did you try this one? https://www.prorealcode.com/prorealtime-indicators/candlesticks-patterns-indicator/
Wow, I’m speechless, so complete…
Thank you!
Bonjour merci pour ce code. Mais ca ne va pas il ne détecte les structures qu’en fonction de la couleur des chandeliers et non pas en fonction de leur emplacement sur le graphique. Sous résistance si le code détecte une étoile filante il l’appellera marteau inversé au lieu d’étoile filante, comme il apelera un pendu marteau etc …. Ca fausse tout et c’est donc erroné. Je rêve d’un code sachant reconnaître les structure en fonction de l’emplacement (creux, sommet, ligne de tendance, support résistance, niveau de fibonacci, etc ….Et sachant s’adapter en fonction du marché (action, forex) car les structures ne sont pas les m^mes pour cause d’absence de gaps sur le forex
Pour cela il faudrait définir comment détecter les supports et résistances, comment et où calculer les niveaux de Fibonacci. Ces niveaux étant très visuels, et le code étant strict, il faut d’abord mettre en corrélation l’homme et la machine 🙂
Ensuite, il est fort probable que nous soyons bloqués par le manque de possibilités du langage de programmation quant aux stockages des données de façon dynamique (pas de tableau de données).
Ce code est une conversion fidèle d’un indicateur d’une autre plateforme.
Merci beaucoup pour cette réponse Nicolas. Je ne peux rien dire parce que je suis totalement ignorant en programmation. Je sais que le logiciel (cher sans doute pas pour rien) de Streve Nison le fait. A la limite, il me semblerait donc polus judicieux de detecter les structures mais sans y adosser le nom. Sinon c’est un peu dangereux pour le débutant. Un débutant qui a appris qu’un marteau est une structure haussière qui en haut de tendance ou somment voit “marteau” pourrait acheter alors qu’il s’agit d’un pendu baissier. Tout est un peu comme ça, des étoiles filantes sont nommées marteau inversé, on trouve des couvertures en nuages noir sur creux (figure de retournement baissière sur sommet), etc ….. Donc sans le nom, le trader voit les figures et à lui de savoir les interpréter en fonction de s’ils les trouvent sur creux, sommet, résistance, support, etc ….. S’il suffisait de juste reconnaître la morphologie… Mais ce n’est pas le cas
Hi, great indicator. I shortened the text for better visuality but there ist a problem. Everything works fine in all timeframes until I switch to the daily chart an higher. Arrows and text appear one candle to the left. How can i fix that? TIA
It can happens in weekly chart, there is nothing to do about that.
Cypressat, tu as essayé l’autre indicateur que mentionne Nicolas ? https://www.prorealcode.com/prorealtime-indicators/candlesticks-patterns-indicator/
Bonjour Nicoles,
je continue à bosser tes indicateurs qui sont très pertinent et je m’intéresse à celui-ci.
Existe-t-il un screener pour détecter une unique figure : ex. Morning star
Merci pour ton aide
https://www.prorealcode.com/prorealtime-market-screeners/simple-evening-star-morning-star-candlestick-patterns-screener/
https://www.prorealcode.com/prorealtime-market-screeners/trend-reversal-continuation-patterns/
https://www.prorealcode.com/tag/candlesticks/
merci mais je voulais utiliser ton indicateur en mode screener et sélectionner uniquement les figures qui m’intéressent
j’ai pris celui-ci https://www.prorealcode.com/prorealtime-market-screeners/simple-evening-star-morning-star-candlestick-patterns-screener/
mais quand je le lance, j’ai un décalage d’une journée avec ton indicateur
//Author: Francesco
//Date: 20-01-2017
//BaseCandle parameter = first candle of the pattern, starting from right (it is possible to run screener staring from any past candle)
BaseCandle = 0
Open0 = Open[BaseCandle]
Close0 = Close[BaseCandle]
Open1 = Open[BaseCandle + 1]
Close1 = Close[BaseCandle + 1]
Open2 = Open[BaseCandle + 2]
Close2 = Close[BaseCandle + 2]
Open3 = Open[BaseCandle + 3]
Close3 = Close[BaseCandle + 3]
//Evening Star
EvStar = Open0 > Close0 And Open0 Close1 And Close1 > Close2 And Open2 Close3 And Open3 < Close3
//Morning Star
MornStar = Open0 Close1 And Open1 < Close1 And Close1 Close2 And Close2 Close3
//Go Short Signal = -1
If EvStar then
Go = -1
endif
//Go Long Signal = 1
If MornStar then
Go = 1
endif
Condition = (EvStar Or MornStar)
SCREENER[Condition] (Go AS “Go”)
Si tu utilises un compte gratuit “fin de journée”, alors les résultats sont décalés d’1 chandelier, c’est normal.
Et si je prends éventuellement celui-ci, comment puis je programmer le screener pour qu’il me sorte uniquement la figure qui m’intéresse ?
https://www.prorealcode.com/prorealtime-market-screeners/trend-reversal-continuation-patterns/
Pour des demandes personnalisées, merci d’utiliser le forum, en ouvrant un nouveau sujet tout en respectant les règles de publication.
c fait 🙂
https://www.prorealcode.com/topic/pro-screeners-trend-reversal-continuation-patterns/