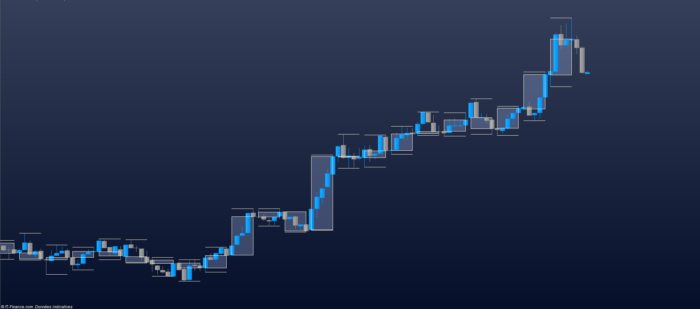
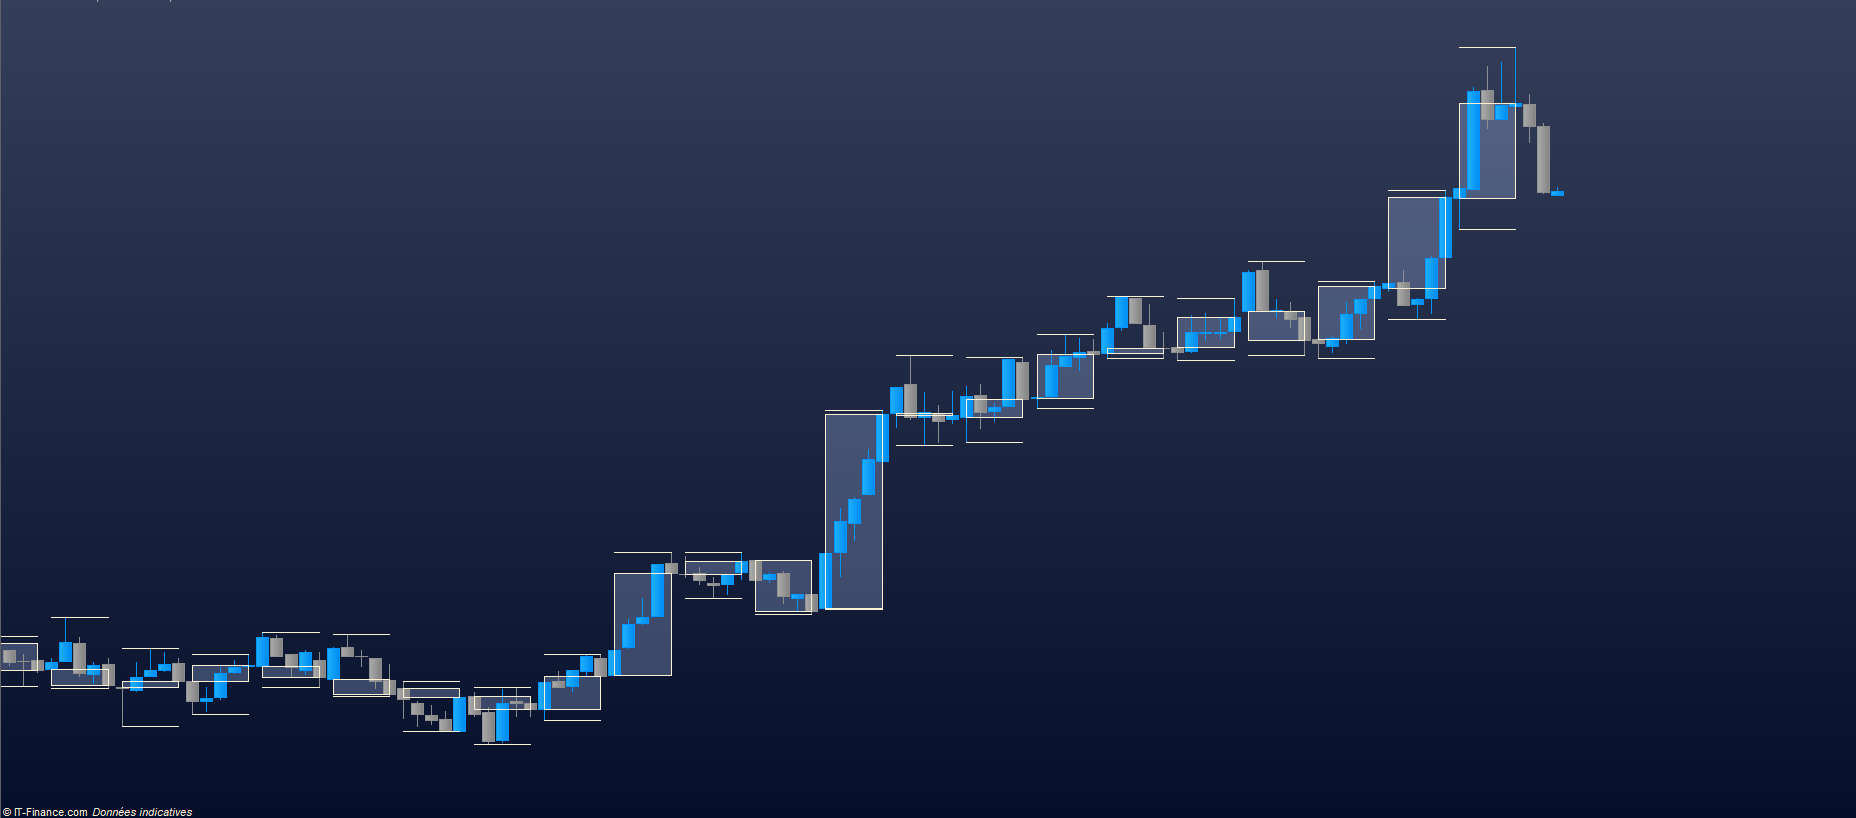
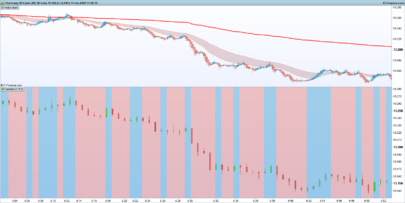
After a lot of laborious testing, I finally managed to code a 5 minute candlestick on a 1 minute unit of time.
This indicator has no concrete purpose in use as displayed on the presentation image.
On the other hand, you can use these variables to give your indicators the exact coordinates of a higher timeframe.
In short, no more approximate use of the multiplier!
This only gives the variables adapted to 5 minutes, if you want another unit of time you can ask via the forum or do it on your own.
Yours sincerely,
IV
|
1 2 3 4 5 6 7 8 9 10 11 12 13 14 15 16 17 18 19 20 21 22 23 24 25 26 27 28 29 30 31 32 33 34 35 36 37 38 39 40 41 42 43 44 45 46 47 48 49 50 51 52 53 54 55 56 57 58 59 60 61 62 63 64 65 66 67 68 69 70 71 72 73 74 75 76 77 78 79 80 81 82 83 84 85 86 87 88 89 90 91 92 93 94 95 96 97 98 99 100 101 102 103 104 105 106 |
// //=/===============/=//=/===============/=//=/ Indicator TimeFrame // // //=/===============/=//=/===============/=//=/ Selection TimeFrame // //=/ 5Minutes X5Minutes = 000500 //=/ Selection Selection = X5Minutes // //=/===============/=//=/===============/=//=/ Basic Values // //=/ Values XTimeframe = 000000+Selection CountDown = 0 Initianl = 000100 // //=/===============/=//=/===============/=//=/ Calculation of Values // //=/ start of countdown if time = Initianl + XTimeframe then Initianl = Initianl[1] + XTimeframe endif if time > Initianl then CountDown = CountDown[1]+1 endif //=/ Reboot of the countdown if CountDown[1] = 4 then CountDown = 0 endif // //=/===============/=//=/===============/=//=/ Candle Level // //=/ Patch TT = round(CountDown) //=/ Open XOpen = open[TT] //=/ Close XClose = XOpen+(Close-XOpen) //=/ High if XHigh < XOpen then XHigh = XOpen elsif TT = 0 then XHigh = Highest[1](high) elsif TT = 1 then XHigh = Highest[2](high) elsif TT = 2 then XHigh = Highest[3](high) elsif TT = 3 then XHigh = Highest[4](high) elsif TT = 4 then XHigh = Highest[5](high) endif //=/ Low if XLow > XOpen then XLow = XOpen elsif TT = 0 then XLow = Lowest[1](Low) elsif TT = 1 then XLow = Lowest[2](Low) elsif TT = 2 then XLow = Lowest[3](Low) elsif TT = 3 then XLow = Lowest[4](Low) elsif TT = 4 then XLow = Lowest[5](Low) endif //=/ Candle if TT = 4 then Drawrectangle(Barindex[TT],XOpen,Barindex,XClose) endif // High Wick if TT = 4 then Drawsegment(Barindex[TT],XHigh,Barindex,XHigh) endif //=/ Low Wick if TT = 4 then Drawsegment(Barindex[TT],XLow,Barindex,XLow) endif // //=/===============/=//=/===============/=//=/ End // return XOpen as "Open", XClose as "Close", XHigh as "High", XLow as "Low" |
Share this
No information on this site is investment advice or a solicitation to buy or sell any financial instrument. Past performance is not indicative of future results. Trading may expose you to risk of loss greater than your deposits and is only suitable for experienced investors who have sufficient financial means to bear such risk.
ProRealTime ITF files and other attachments :PRC is also on YouTube, subscribe to our channel for exclusive content and tutorials

Hi, when applying the indicator to a screen I get an error that TT must have a value and be bigger than 0. Do I have to fill in variables somewhere?
I suggest you download the itf file to get the complete code
Same for me 😉
Also make sure you have enough data to display the entire indicator
Hey thanks for the work, I was excited hoping it would work on 100 ticks saving me some space but I get the same error. If the timeframe is changed to 1day, it seems to be working tho
salut sa ne marche pas
I added this indicator into 1 min TF chart. It only show two black line on the candles. Any idea??