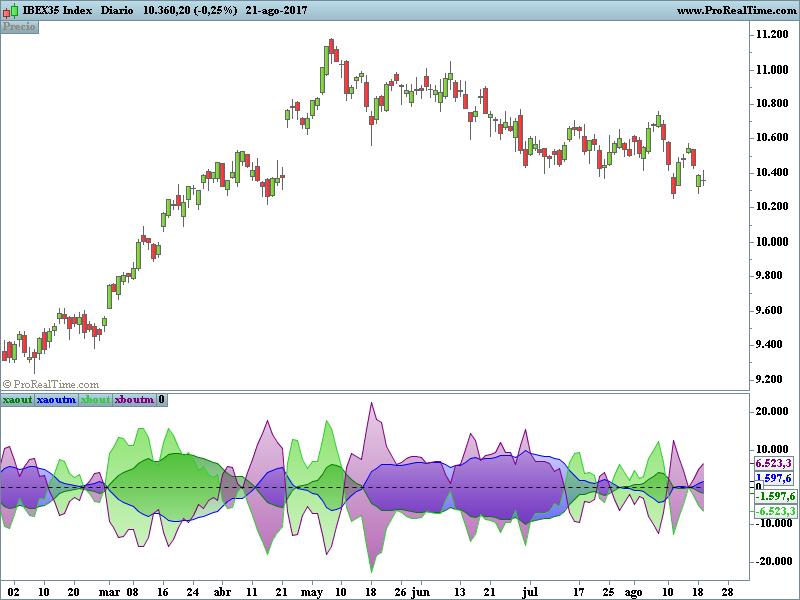
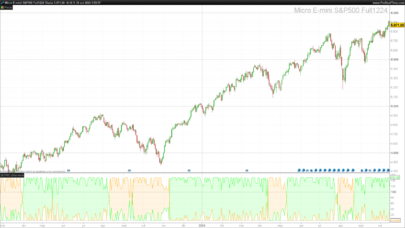
Prorealtime adaptation of the Carbon Double Wam indicator appeared on the Tradingview platform, created by Carbon.
The objective of this indicator is to highlight the relationship between different market cycles with two periods, 3 and 21.
The Wam short period provides early signs of trend change, the long period remains bullish or bearish in most of the trend.
The lime and purple colors belong to the short bullish and bearish period.
The dark green and blue colors belong to the long bullish and bearish period.
This indicator can be used for short and long period crossings.
Adaptación para Prorealtime del indicador Carbon Double Wam aparecido en la plataforma Tradingview , creado por Carbon.
El objetivo de este indicador es destacar la relación entre distintos ciclos de mercado con dos periodos , 3 y 21.
El periodo corto Wam proporciona señales tempranas de cambio de tendencia , el periodo largo se mantiene en modo alcista o bajista en la mayor parte de la tendencia.
Los colores lima y púrpura pertenecen al periodo corto alcista y bajista.
Los colores verde oscuro y azul pertenecen al periodo largo alcista y bajista.
Se puede utilizar este indicador en busca de los cruces de corto y largo periodo.
|
1 2 3 4 5 6 7 8 9 10 11 12 13 14 15 16 17 18 19 20 21 22 23 24 25 26 27 28 29 30 |
REM CARBON DOUBLE WAM //código original del indicador por Carbon para la plataforma Tradingview //adaptación para Prorealtime por bolsatrilera //---------------------------------------------------- alen = 21// title="Primary Period 1") blen = 3 //title="Primary Period 2") smlen = 21 //title="Smoothing Period 1") smlen2 = 21 //title="Smoothing Period 2") src = close //title="Source") lag = 1 //title="Primary Lag") smlag = 1 //title="Smoothing Lag") //---------------------------------------------------- // First WAM aout =ExponentialAverage[alen](src) aoutlagged = aout[lag] awout =ExponentialAverage[smlen](aout-aoutlagged) xaout =ExponentialAverage[smlen2](awout - awout[smlag]) * 10000 xaoutm = -xaout // --------------------------------------------------- // Second WAM bout =ExponentialAverage[blen](src) boutlagged = bout[lag] bwout = ExponentialAverage[smlen](bout - boutlagged) xbout =ExponentialAverage[smlen2](bwout - bwout[smlag]) * 10000 xboutm = -xbout return xaout coloured(0,128,0)as "xaout",xaoutm coloured(0,0,255)as "xaoutm",xbout coloured(50,205,50)as "xbout",xboutm coloured(128,0,128)as "xboutm", 0 as "0" |
Share this
No information on this site is investment advice or a solicitation to buy or sell any financial instrument. Past performance is not indicative of future results. Trading may expose you to risk of loss greater than your deposits and is only suitable for experienced investors who have sufficient financial means to bear such risk.
ProRealTime ITF files and other attachments :PRC is also on YouTube, subscribe to our channel for exclusive content and tutorials









Hi Bolsatrilera,
I love this indicator! Thanks;
=> did you develop a strategy around it? I am interested!
Cheers,
Chris