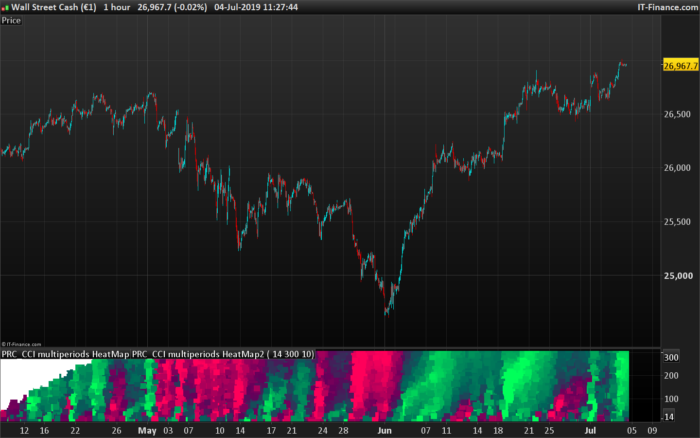
This “heatmap” type indicator plots the returned values of the CCI oscillator for all its calculated periods between the values of “StartPeriod” up to “MaxScale”. Each value is colored according to its degree of over-sold (in light red) and over-bought (in light green).
Darker areas mark the “no trend” zones or “end of trend” moment.
The more reddish is the whole area, the more bearish if the trend.
The more greenish is the whole area, the more bullish if the trend.
This indicator is another derived version of the RSI heat map posted earlier in the library.
The ensemble thus forms a cloud of colored dots making it easy to better identify how the market behaves in the different dimensions.
It is thus possible to determine the best opportunities for positions in trend following or mean reversion without wondering what is the best period of observation with respect to the instrument and the timeframe used. .
|
1 2 3 4 5 6 7 8 9 10 11 12 13 14 15 16 17 18 19 20 21 22 23 24 25 26 27 28 29 |
//PRC_CCI multiperiods HeatMap | indicator //Plot an heatmap of the CCI range of periods //04.07.2019 //Nicolas @ www.prorealcode.com //Sharing ProRealTime knowledge // --- settings startperiod=20 //start period of the loop maxscale=500 //end period of the loop Step=10 //period step of the loop // --- end of settings iPeriod=startperiod //first period to test is..startperiod while iPeriod<=maxscale do // --- indicator calculation osc = cci[iperiod] // ----- R = max(0,50-osc) G = max(0,50+osc) drawtext("■",barindex,iperiod,dialog,bold,18) coloured(min(r,255),min(g,255),90) iPeriod=max(startperiod,iPeriod+Step) //increase indicator period for next loop iteration wend return startperiod,maxscale |
Share this
No information on this site is investment advice or a solicitation to buy or sell any financial instrument. Past performance is not indicative of future results. Trading may expose you to risk of loss greater than your deposits and is only suitable for experienced investors who have sufficient financial means to bear such risk.
ProRealTime ITF files and other attachments :
Find other exclusive trading pro-tools on ![]()
PRC is also on YouTube, subscribe to our channel for exclusive content and tutorials


Nice indicator ! Can be modified for stochastic by replacing line 18 with Stochastic[iperiod,3](close) , doesnt it ?
Yes, but the problem is the color scheme because each indicator doesn’t share the same scale. I suggest you open a topic to discuss color scheme shading for each of the heatmap indicator. Will put the link here.
Posted here: (stochastic 3d heatmap) = https://www.prorealcode.com/topic/possible-to-code-this-in-prt/page/2/#post-101985
I also tried to program on the CCI heatmap, not as nice as you! Thank you
Good morning Nicolas,
Would it be possible to have a screener to know the moments of maximum “light green”?
Thank you very much
Something had been made for that: https://www.prorealcode.com/topic/screener-rsi-multiperiods-heatmap/
It test the moment of when green is superior to red or vice-versa.
Thank you. I really like this indicator to start a survey in 1h and 2h frames.
Bonjour Nicolas ,
je voulais simplement te dire merci pour cet indicateur.
Très simple et efficace !!!
Hi Nicolas,
Excellent piece of code. I used your concept in one of my own indicators too which simply works perfectly.
For what it is worth, I changed the black square (ASCII 254) to a black block (ASCII 219) and at least for me it improved the display.
drawtext(“■”,barindex,iperiod,dialog,bold,18) coloured(min(r,255),min(g,255),90)
changed to
drawtext(“█”,barindex,iperiod,dialog,bold,18) coloured(min(r,255),min(g,255),90)
Thanks a lot for the tip.