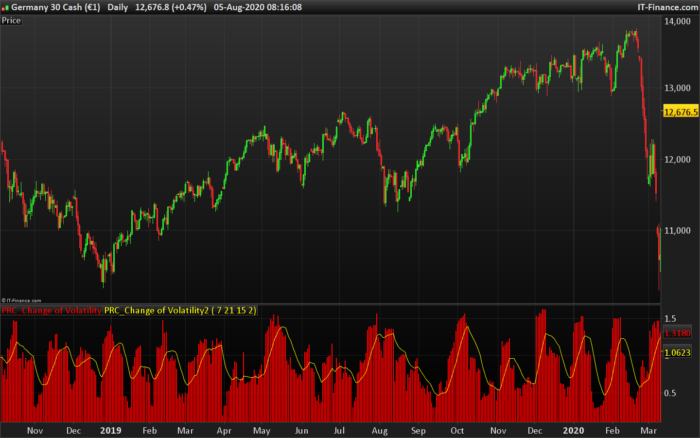
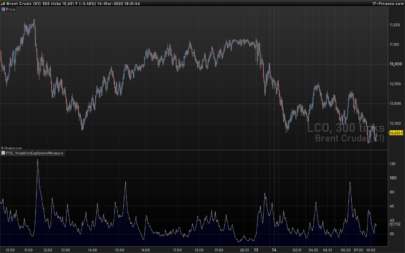
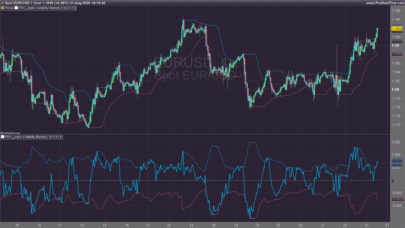
There are a lot of ways to measure volatility (changeability). One of them is calculation of the standard deviation of returns for a certain period of time. Sometimes the current volatility on a short period of time (for example, 6 days) is correlated with volatility of a larger period (for example 100 days). This indicator calculates the correlation of a short volatility Vol_short and a long volatilityVol_long. Vol_change=Vol_short/Vol_long
Vol_k=Std(Mom,k),
where k is the period of volatility change.
(description from the author)
Indicator of volatility converted following a request in the indicators forum section.
|
1 2 3 4 5 6 7 8 9 10 11 12 13 14 15 16 17 18 19 |
//PRC_Change of Volatility | indicator //05.08.2020 //Nicolas @ www.prorealcode.com //Sharing ProRealTime knowledge //converted from MT4 //https://www.prorealcode.com/topic/conversion-of-indicator-change-of-volatility-from-mt4/ // --- settings Short = 6 Long = 100 SigMA = 15 SigMAMode = 2 //0 = SMA 1 = EMA 2 = WMA 3 = Wilder 4 = Triangular 5 = End point 6 = Time series 7 = Hull (PRT v11 only) 8 = ZeroLag (PRT v11 only) // --- end of settings Moment=Momentum[1](close)/100 HVBuffer=std[Short](Moment)/std[Long](Moment) Ma = average[SigMA,SigMAMode](HVBuffer) return HVBuffer coloured(255,0,0) style(histogram), Ma coloured(255,255,0) style(line,1) |
Share this
No information on this site is investment advice or a solicitation to buy or sell any financial instrument. Past performance is not indicative of future results. Trading may expose you to risk of loss greater than your deposits and is only suitable for experienced investors who have sufficient financial means to bear such risk.
ProRealTime ITF files and other attachments :PRC is also on YouTube, subscribe to our channel for exclusive content and tutorials
