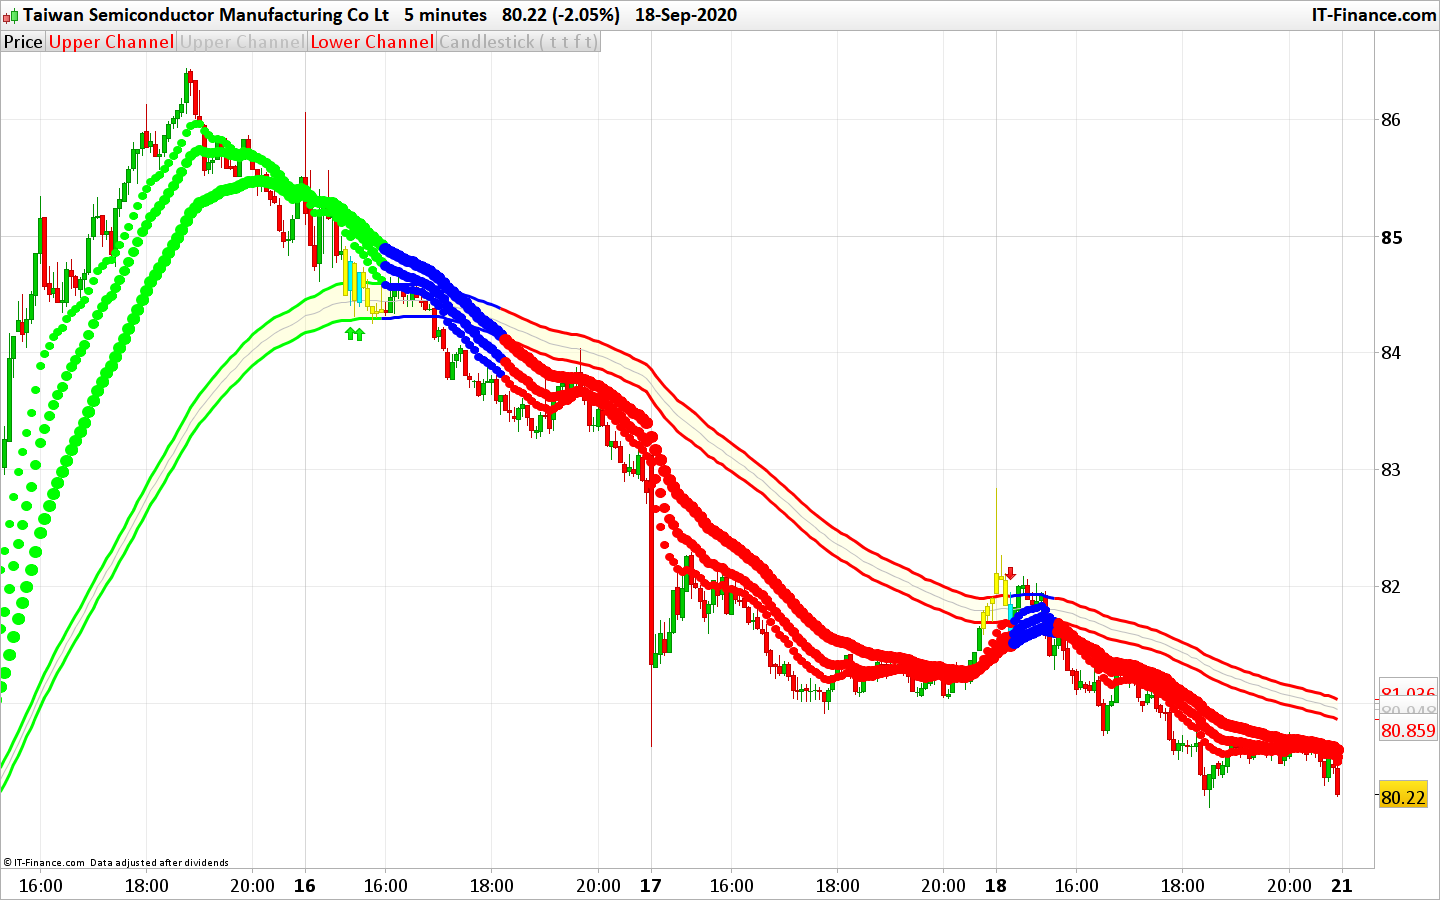
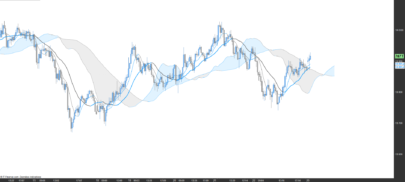
A slingshot reversal is a reliable trading pattern and is defined as a false breakout + reversal and occurs when a major support or resistance point is broken but the price does not hold below support or above resistance and moves back into it’s previous trend.
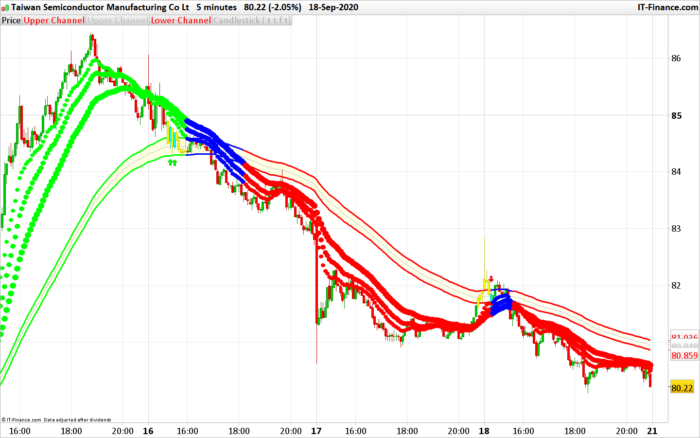
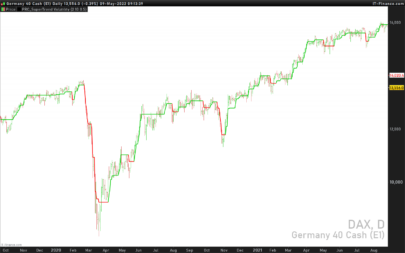
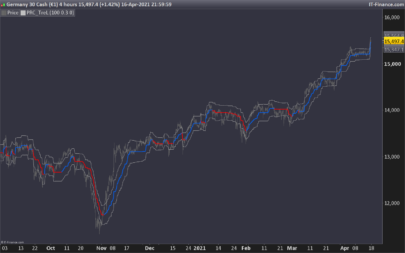
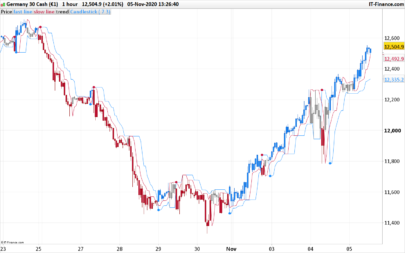
This indicator identifies and plots the slingshot pattern on the price chart. A long term trend channel (with lines) and a medium term ones (with dots) help to identify the potential continuation entries after a pullback in the major trend.
Code translated following a query in the indicator’s forum section.
|
1 2 3 4 5 6 7 8 9 10 11 12 13 14 15 16 17 18 19 20 21 22 23 24 25 26 27 28 29 30 31 32 33 34 35 36 37 38 39 40 41 42 43 44 45 46 47 48 49 50 51 52 53 54 55 56 57 58 59 60 61 62 63 64 65 66 67 68 69 70 71 72 73 74 75 76 77 78 79 80 81 82 83 84 85 86 87 88 89 90 |
//PRC_CM_UCS_Modified SlingShot | indicator //21.09.2020 //Nicolas @ www.prorealcode.com //Sharing ProRealTime knowledge //converted from tradingview //https://www.prorealcode.com/topic/conversion-from-tradengview-slingshot/ // --- settings // 1 = true ; 0 = false sae = 1 //Show Aggressive Entry?, Or Use as Alert To Potential Conservative Entry? sce = 1 //Show Conservative Entry? st = 1 //Show Trend Arrows at Top and Bottom of Screen? pa = 1 //Show Conservative Entry Arrows? // --- end of settings ma1 = average[13,1] ma2 = average[21,1] ma3 = average[34,1] ma = average[89,1] irange = tr rangema = average[89](irange) upper = ma + rangema * 0.5 lower = ma - rangema * 0.5 midChan = (upper + lower)/2 //Trend Definition trup = ma1 > upper and ma2 > upper and ma3 > upper trdown = ma1 < lower and ma2 < lower and ma3 < lower //Aggressive Entry pullbackUpT = trup and close < upper pullbackDnT = trdown and close > lower //Conservative Entry entryUpT = trup and close[1] < upper and close > upper entryDnT = trdown and close[1] > lower and close < lower //Conservative Entry True/False Condition entryUpTrend = ma1 > upper and ma2 > upper and ma3 > upper and close[1] < upper and close > upper entryDnTrend = ma1 < lower and ma2 < lower and ma3 < lower and close[1] > lower and close < lower //Define Up and Down Trend for Trend Arrows at Top and Bottom of Screen upTrend = ma1 > upper and ma2 > upper and ma3 > upper downTrend = ma1 < lower and ma2 < lower and ma3 < lower //Definition for Conseervative Entry Up and Down PlotArrows codiff = entryUpTrend //== 1 ? entryUpTrend : 0 codiff2 = entryDnTrend //== 1 ? entryDnTrend : 0 //Trend Color Definition for Moving Averages and Channel if trup then scolorr = 0 scolorg=255 scolorb=0 elsif trdown then scolorr=255 scolorg=0 scolorb=0 else scolorr=0 scolorg=0 scolorb=255 endif if (sae and pullbackUpT) or (sae and pullbackDnT) then //yellow drawcandle(open,high,low,close) coloured(255,255,0) endif if (sce and entryUpT) or (sce and entryDnT) then //aqua drawcandle(open,high,low,close) coloured(0,255,255) endif //Plot 3 MA’s drawtext("●",barindex,ma1,dialog,bold,10) coloured(scolorr,scolorg,scolorb) //fast MA drawtext("●",barindex,ma2,dialog,bold,13) coloured(scolorr,scolorg,scolorb) //medium MA drawtext("●",barindex,ma3,dialog,bold,16) coloured(scolorr,scolorg,scolorb) //slow MA //Trend Triangles at Top and Bottom of Screen atr=averagetruerange[14](close) if st and uptrend then drawtext("▲",barindex,low-atr/2,dialog,bold,16) coloured(0,255,0) endif if st and downTrend then drawtext("▼",barindex,high+atr/2,dialog,bold,16) coloured(255,0,0) endif //Plot Arrows OR Letters ↑ and ↓ for Buy Sell Signals if pa and codiff then drawarrowup(barindex,low-atr/2) coloured(0,255,0) endif if pa and codiff2 then drawarrowdown(barindex,high+atr/2) coloured(255,0,0) endif return upper coloured(scolorr,scolorg,scolorb) style(line,3) as "Upper Channel", midChan coloured(192,192,192) style(line) as "Mid Channel", lower coloured(scolorr,scolorg,scolorb) style(line,3) as "Lower Channel" |
Share this
No information on this site is investment advice or a solicitation to buy or sell any financial instrument. Past performance is not indicative of future results. Trading may expose you to risk of loss greater than your deposits and is only suitable for experienced investors who have sufficient financial means to bear such risk.
ProRealTime ITF files and other attachments :PRC is also on YouTube, subscribe to our channel for exclusive content and tutorials



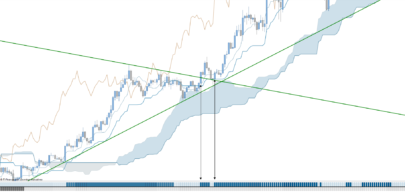
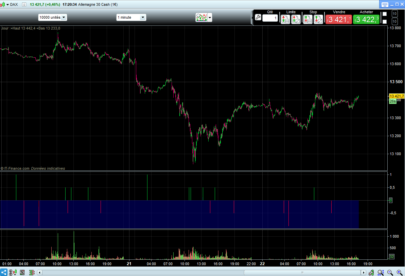

its not plotting on chart but instead as it’s own histogram directly below chart? How to fix this problem. (Using v-10.3)
by adding the indicator on the chart 🙂