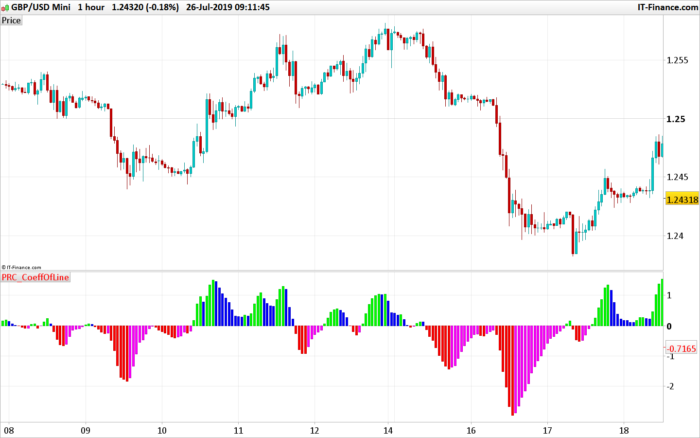
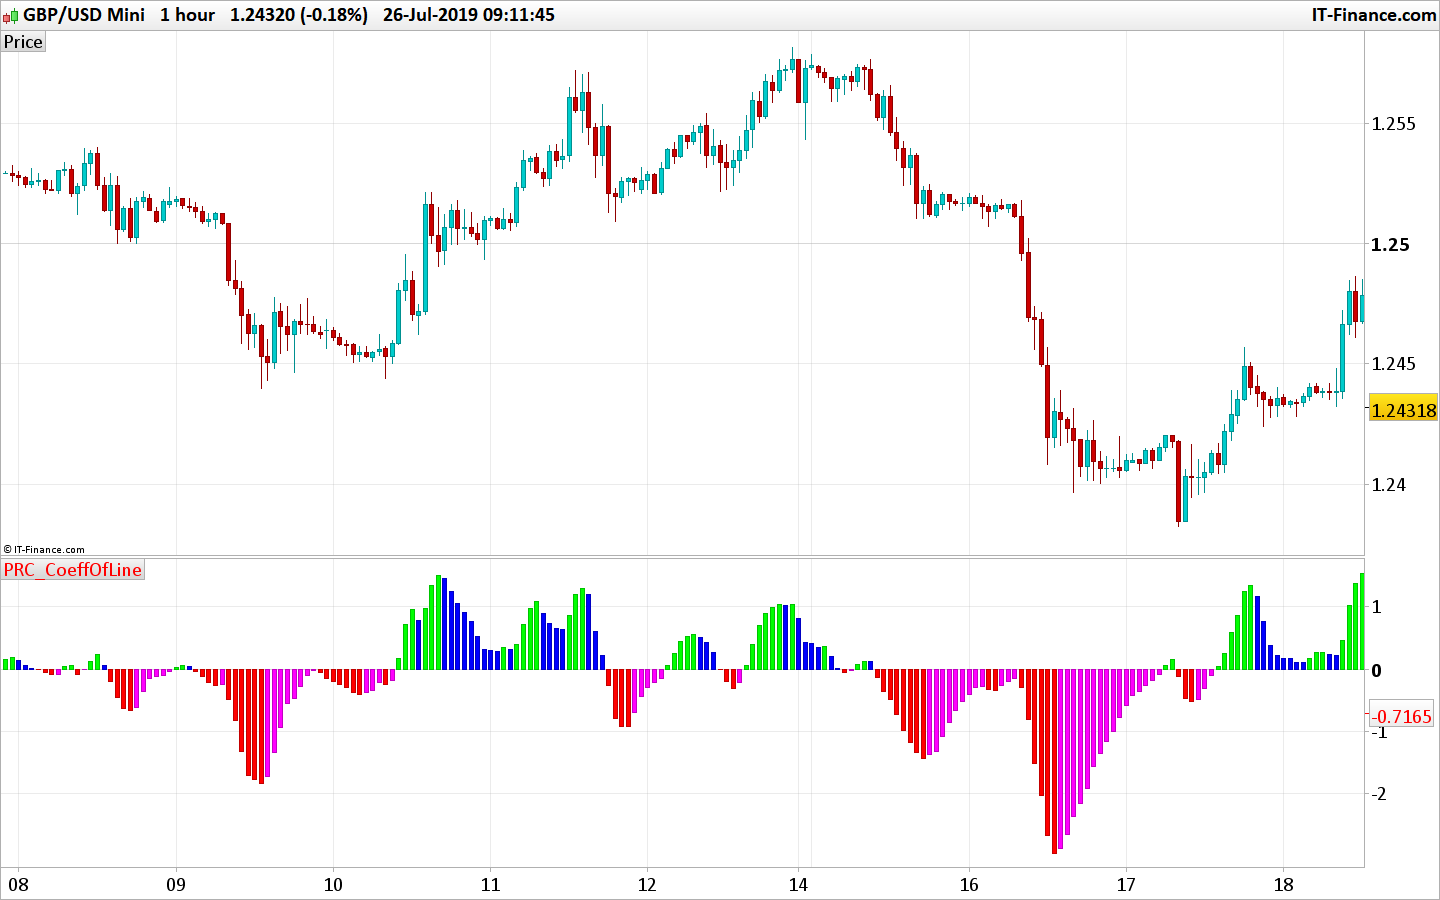
CoeffofLine indicator shows the most likely future price direction (2-3 bars).
The indicator depends on symbol, timeframe and period. If the indicator is turned up, it’s a signal to open long position. A signal to close long position is: turn down of the indicator and a confirmation from lower timerframe (negative values). The similar rules for short position: turn down on the current timeframe, for closing of short position it needs a confirmation from lower timeframe (positive values).
description found on the web. Indicator converted from MT4 by a request in the indicators forum section.
|
1 2 3 4 5 6 7 8 9 10 11 12 13 14 15 16 17 18 19 20 21 22 23 24 25 26 27 28 29 30 31 32 33 34 35 36 37 38 39 40 41 42 43 44 45 46 47 48 49 50 51 52 53 54 |
//PRC_CoeffOfLine | indicator //26.07.2019 //Nicolas @ www.prorealcode.com //Sharing ProRealTime knowledge ndot=5 TYVar=0 ZYVar=0 N=0 M=0 TIndicatorVar=0 ZIndicatorVar=0 for cnt=ndot downto 1 do ZYVar=ZYVar+(High[cnt-1]+Low[cnt-1])/2*(6-cnt) TYVar=TYVar+(High[cnt-1]+Low[cnt-1])/2 N=N+cnt*cnt M=M+cnt wa=wilderaverage[5](medianprice)[3] ZIndicatorVar=ZIndicatorVar+wa[cnt-1]*(6-cnt) TIndicatorVar=TIndicatorVar+wa[cnt-1] next AY=(TYVar+(N-2*ZYVar)*ndot/M)/M AIndicator=(TIndicatorVar+(N-2*ZIndicatorVar)*ndot/M)/M cfl=(-1000)*Log(AY/AIndicator) if cfl>cfl[1] then if cfl>0 then r=0 g=255 b=0 endif if cfl<0 then r=255 g=0 b=255 endif else if cfl>0 then r=0 g=0 b=255 endif if cfl<0 then r=255 g=0 b=0 endif endif return cfl coloured(r,g,b) style(histogram) |
Share this
No information on this site is investment advice or a solicitation to buy or sell any financial instrument. Past performance is not indicative of future results. Trading may expose you to risk of loss greater than your deposits and is only suitable for experienced investors who have sufficient financial means to bear such risk.
ProRealTime ITF files and other attachments :PRC is also on YouTube, subscribe to our channel for exclusive content and tutorials


Bonjour Nicolas,
Merci pour cet indicateur.
Il semble fonctionner à l’envers suivant si on l’applique sur un indice ou une paire de devise.
Est-ce normal ?
Oui c’est déjà le cas dans la version originale. Il faut pour cela changer la ligne 28 en supprimant le “-” :
cfl=(1000)*Log(AY/AIndicator)
Hi Nicolas, the indicator is exactly the way around when you put it on a dailychart. Whats is up, must be down and the way around. Can you look at this for yourself and change the code so that RED is that de graph is going down (BELOW THE LINE) and Green (ABOVE THE LINE) is that the stock is going UP? Know when the line is above zero, the graph (daily) is moving downwards.. Is a nice indicator, but exact the way around.
Remove the minus symbol at line 28: cfl=(1000)*Log(AY/AIndicator)
Hi Nicolas, i am not that of a coder.. Did you make already a new PRC so we can download the better newer version and see if it works ok now?
Was easier than i thought! thanks! it works now great!
Bonjour Nicolas,
L’indicateur n’affiche rien, peux tu m’aider stp ?