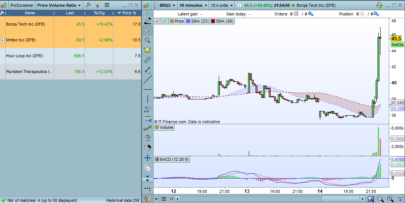
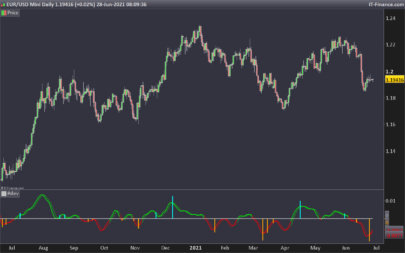
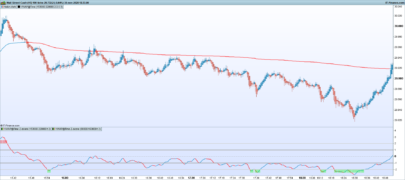
This indicator is very interesting for detection of stocks volumes large increase. By testing the high and low price of the previous candle, we affect the oscillator by adding or substracting the current price range multiplied by the present volume. While a new bullish trend is actually forming the oscillator make new highs or new lows for a bear market.
By adding the weigth of the volume to the actual range, high volumes help identifying the premise of a new trend of a reversal one. The signal line made of an exponential moving average also add information on the trend continuation or not.
If price fail to make new upper or lower range than the previous one, then the oscillator will stay flat until price is making a significant move.
This indicator deserve more exploration and would be converted to a stock screener for stocks picking. Anyone ?
|
1 2 3 4 5 6 7 8 9 10 11 12 13 14 15 |
if(barindex>10) then sRange = (high-low) if(high<high[1] AND low<low[1]) then CumVolVel = CumVolVel[1]-sRange*Volume elsif(high>high[1] AND low>low[1]) then CumVolVel = CumVolVel[1]+sRange*Volume else CumVolVel = CumVolVel[1] endif endif avg = exponentialaverage[p](CumVolVel) RETURN CumVolVel coloured(255,0,0) as "Cumulated volume", avg coloured(0,0,255) as "signal line" |
Share this
No information on this site is investment advice or a solicitation to buy or sell any financial instrument. Past performance is not indicative of future results. Trading may expose you to risk of loss greater than your deposits and is only suitable for experienced investors who have sufficient financial means to bear such risk.
ProRealTime ITF files and other attachments :PRC is also on YouTube, subscribe to our channel for exclusive content and tutorials


