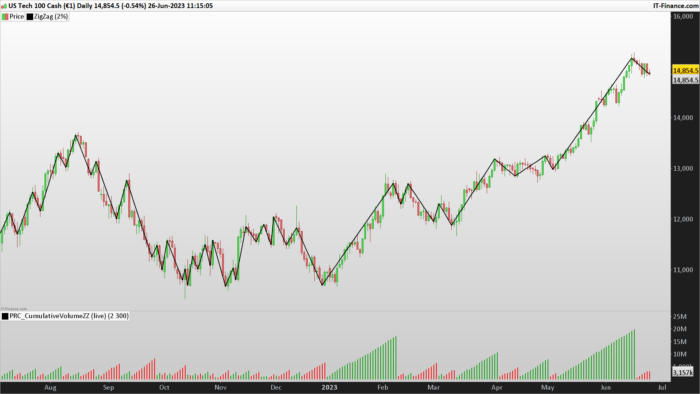
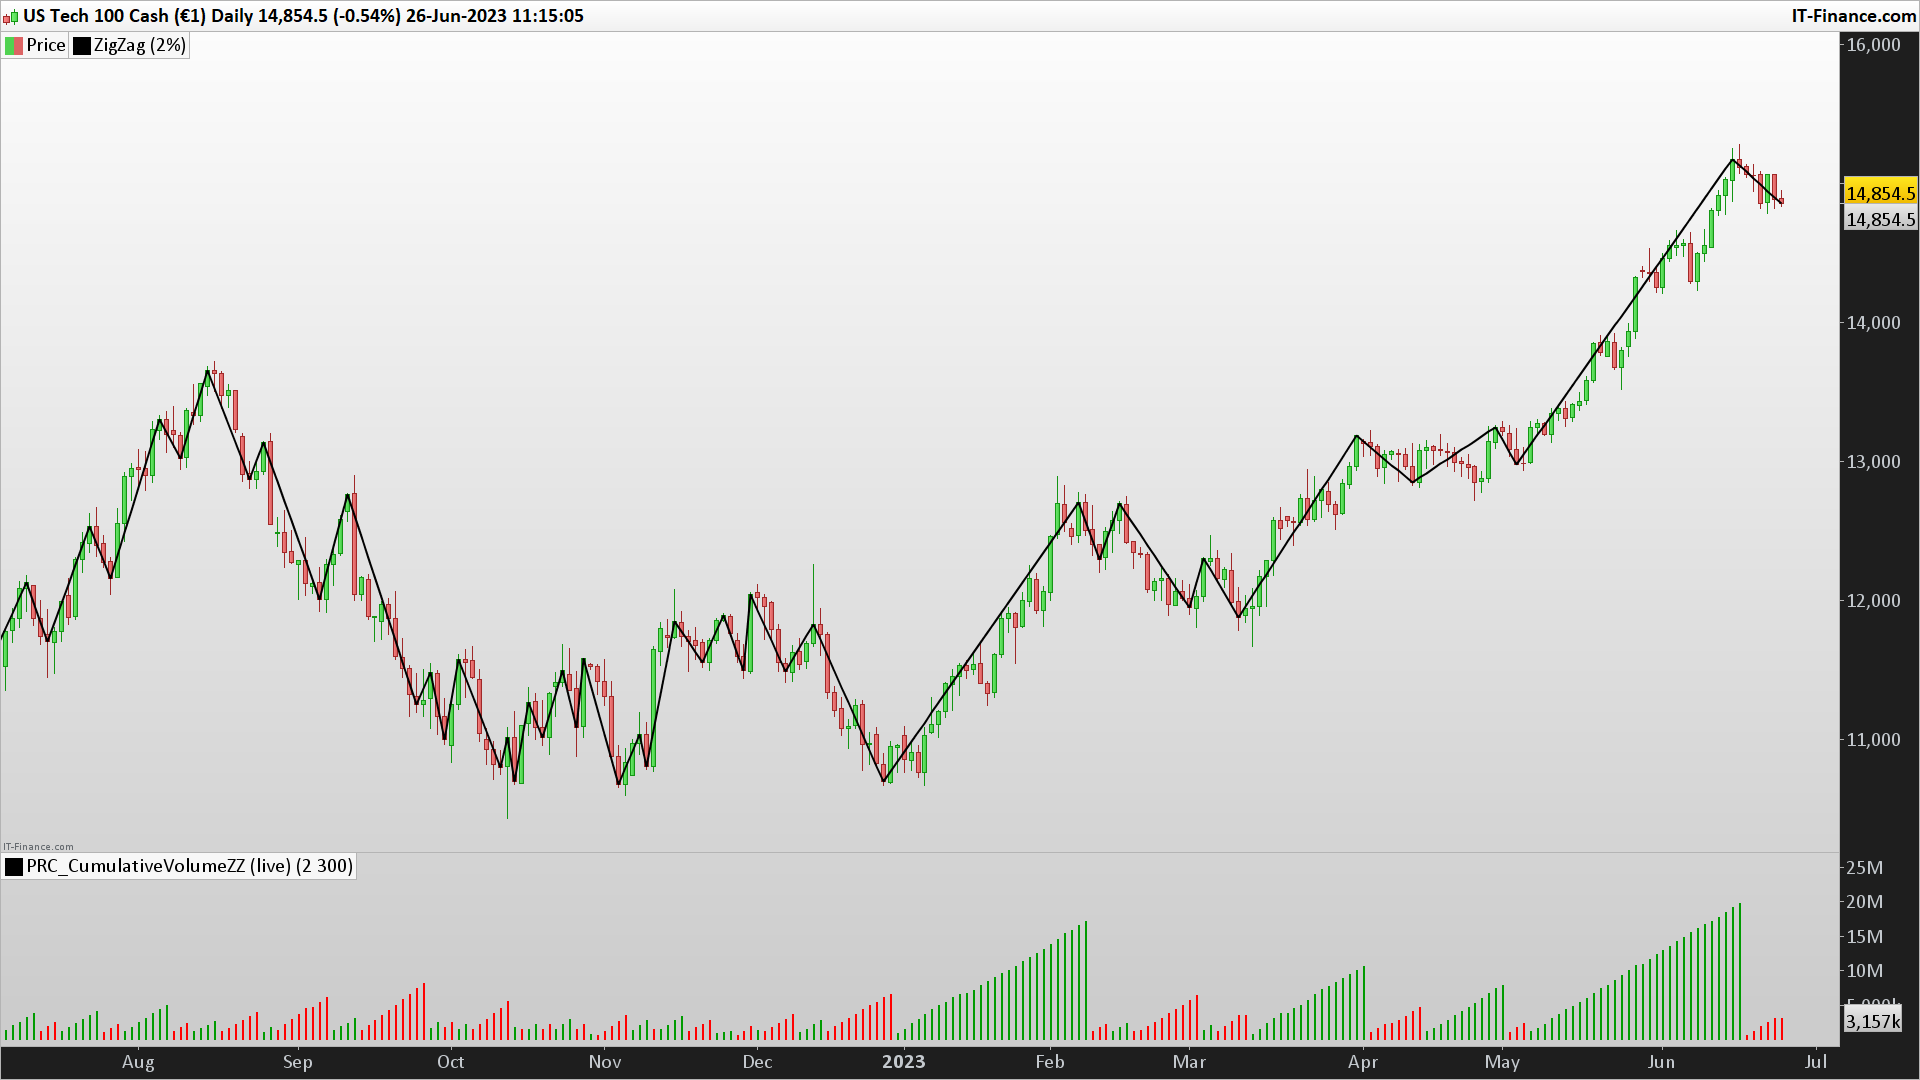
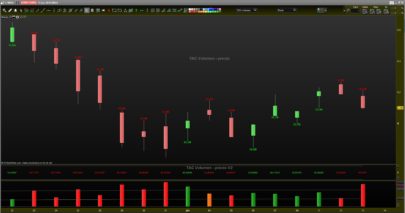
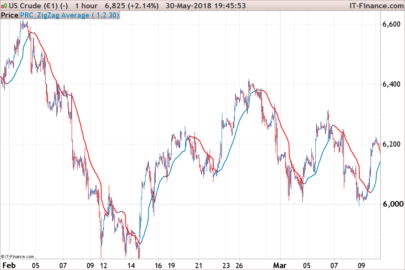
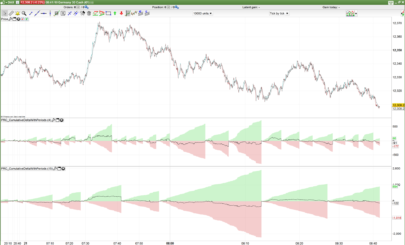
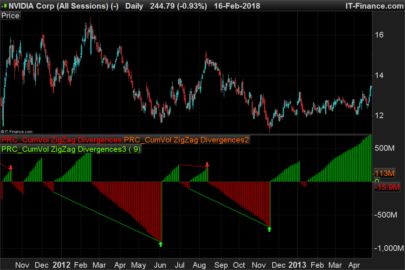
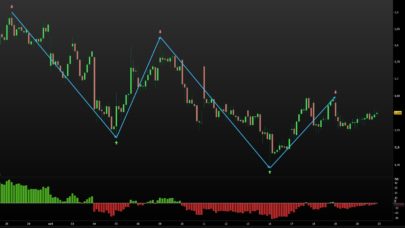
This Cumulative Volume indicator helps in understanding the change in volume related to peaks and troughs (referred to as ‘tough’ in the code) of price movement based on the ZigZag indicator.
Here is a detailed explanation of the code:
defparam drawonlastbaronly=true: This line sets the parameter to draw the indicator only on the last bar of the chart to save computation resources.- The parameters are set:
percentVariationis set to 0.04, which defines the minimum price change necessary for the ZigZag indicator to alter its direction.BarsLimitis set to 200, which is the maximum number of bars for which the histogram is drawn. zz = ZigZag[percentVariation](close): This line calculates the ZigZag indicator based on the closing prices and the percent variation defined.peak = zz<zz[1] and zz[1]>zz[2]andtough = zz>zz[1] and zz[1]<zz[2]are lines that define conditions for identifying peaks and troughs. A peak is identified when the current ZigZag value is less than the previous value and the previous value was greater than the one before it. Similarly, a trough is identified when the current ZigZag value is greater than the previous one and the previous value was less than the one before it.cumV = cumV+volume: This line is used to calculate the cumulative volume up to the current bar.- The array
$barvolis used to store the cumulative volume for each bar. The$barcolorarray is used to store the color for the current trend. - If a peak or trough is identified, the cumulative volume (
cumV) is reset to the current bar’s volume, and the trend color (color) is set accordingly. If a peak is identified,coloris set to -1, indicating a downward trend. If a trough is identified,coloris set to 1, indicating an upward trend. - The
if islastbarupdate thenblock is executed on every last bar update. It draws rectangles on the lastBarsLimitnumber of bars based on the stored volumes and colors. return cumV coloured(0,0,0,0): This line is to return the current cumulative volume as the value of the indicator. The color of this line is set to transparent (all zeros), meaning that the line won’t be visible on the chart. The visual representation of this indicator is done by the rectangles drawn in the previous step.
This code will effectively create a volume histogram where the color of each bar represents the direction of the trend, and the height of the bar represents the cumulative volume of the trend. Peaks and troughs will reset the cumulative volume, starting a new bar in the histogram.
|
1 2 3 4 5 6 7 8 9 10 11 12 13 14 15 16 17 18 19 20 21 22 23 24 25 26 27 28 29 30 31 32 33 34 35 36 37 38 39 40 41 42 43 44 45 |
//PRC_CumulativeVolume ZigZag (live) | indicator //26.06.23 //Nicolas @ www.prorealcode.com //Sharing ProRealTime knowledge defparam drawonlastbaronly=true // — parameters percentVariation = 0.04 BarsLimit = 200 //how many historgram to draw? // ----- zz = ZigZag[percentVariation](close) peak = zz<zz[1] and zz[1]>zz[2] tough = zz>zz[1] and zz[1]<zz[2] cumV = cumV+volume $barvol[barindex]=cumv //store in an array the current volume for that bar $barcolor[barindex]=color //color of current trend if peak then cumV = Volume color = -1 elsif tough then cumV = Volume color = 1 endif if islastbarupdate then a = 0 for i = barindex downto barindex-barslimit do r=255 g=0 if $barcolor[i]>0 then r=0 g=155 endif drawrectangle(barindex[a],$barvol[i],barindex[a],0) coloured(r,g,0) a=a+1 next endif return cumV coloured(0,0,0,0) |
Share this
No information on this site is investment advice or a solicitation to buy or sell any financial instrument. Past performance is not indicative of future results. Trading may expose you to risk of loss greater than your deposits and is only suitable for experienced investors who have sufficient financial means to bear such risk.
ProRealTime ITF files and other attachments :
Find other exclusive trading pro-tools on ![]()
PRC is also on YouTube, subscribe to our channel for exclusive content and tutorials


Il y a une erreur dans le code après installation. “Un caractère de type entier est attendu avec barcolor”
Il doit y avoir impérativement plus d’unités affichées que le paramètre “BarsLimit”. Ceci étant j’ai contasté une erreur dans cette version sur la mise à jour de la dernière jambe du zigzag, je corrigerai bientôt.
Hello Nicolas,
I have a cumulative histogram update problem, the indicator often updates or cumulate only after restarting the indicator, what should I try to do?
Hello Nicolas, if I try to use your indicator in a trading system, the error on prc pops up that that the indicator (ZigZag) contains code that the current “backtest monitor” does not support. Is there a way to fix this? Thanks for replying.
Bonjour Nicolas J’ai le meme souci que steffen , l’indicateur ne cumule qu’après avoir redémarré l’indicateur ou modifier les donné percent variation, une idée? Merci.