







Cumulative volumes zigzag divergences
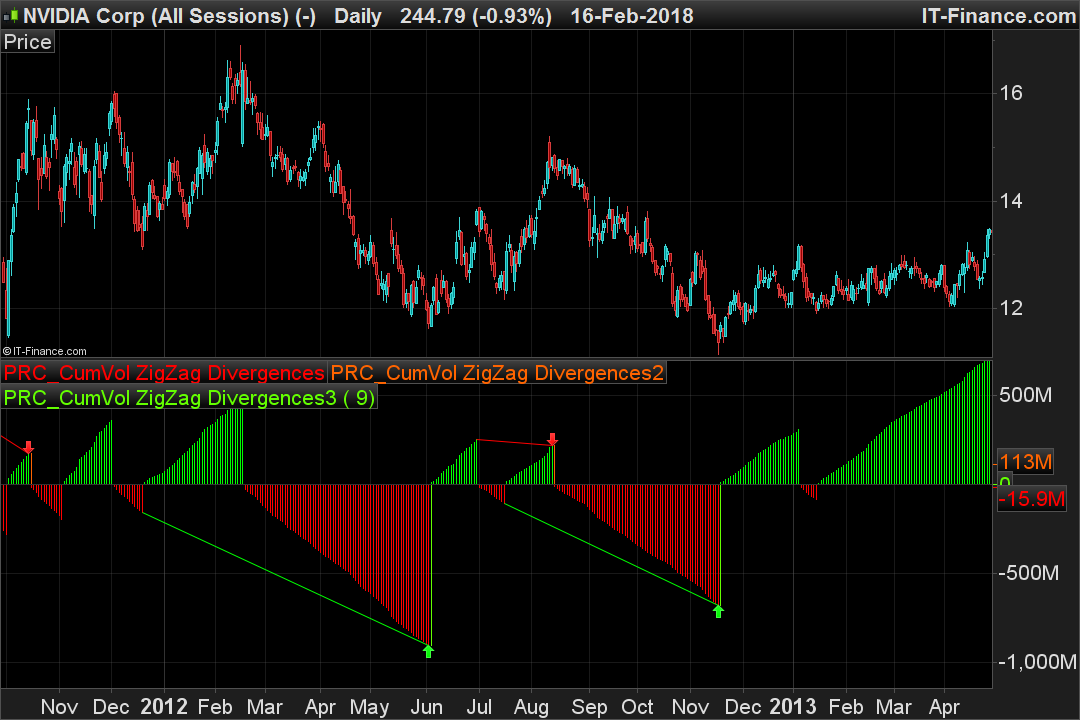
This indicator is based on volume analysis such as the one already posted here: ZigZag Cumulative Volume
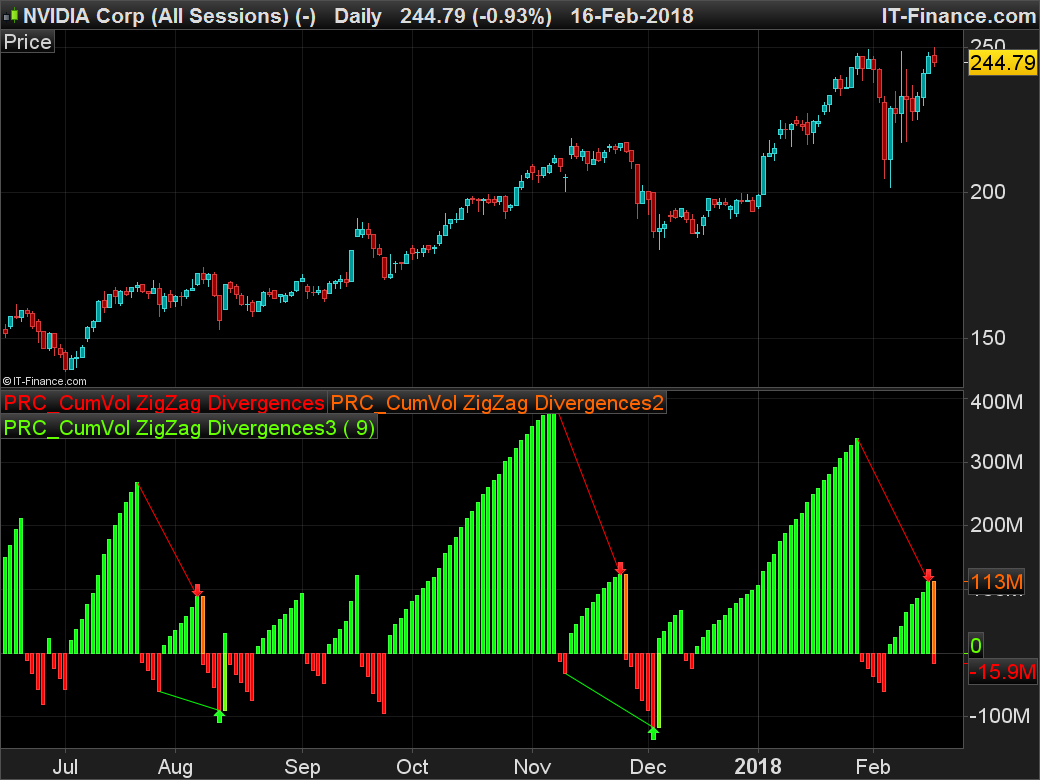
In this version, bullish and bearish divergences are identified according to the volume accumulation and distribution waves in relation to the price.
The waves are calculated using the ZigZag indicator included in the platform.
- Bearish divergence: if the volumes decline between 2 successive waves and the price increases (makes a new high), then a divergence would announce a possible lowering of the price.
- Bullish divergence: if the volumes decline between two successive waves and the price decreases (makes a new low), then a divergence would announce a possible price increase.
The ZigZag waves are adaptable with their validation percentage in the indicator settings or in the code (default is 3%). It will of course be necessary to modify this value according to the instrument and the timeframe used.
Divergences are plotted on the indicator using segments between successive waves and red and green arrows.
Due to its natural behavior, the ZigZag indicator will retrace itself if a new higher or lower is found. As a result, the latest information in the chart may not be completely frozen in real time. On the other hand, in the case of the history of the price graph, the discrepancy information will always be indicated with the last known information which does not necessarily appear on the current bar, but afterwards when the highest or the lowest has has been validated.
Original idea of this indicator came from this French topic: Cumulative Volume Zig Zag – Divergences
//PRC_CumVol ZigZag Divergences | indicator
//14.02.2018
//Nicolas @ www.prorealcode.com
//Sharing ProRealTime knowledge

// --- parameters
percentVariation = 3

zz = ZigZag[percentVariation](close)

peak = zz<zz[1] and zz[1]>zz[2]
tough = zz>zz[1] and zz[1]<zz[2]

if color=1 then
 cumV = cumV+volume
else
 cumV = cumV-volume
endif

if peak then

 lastpeakvol = peakvol
 lastpeakhigh = peakhigh
 lastpeakbar = peakbar
 peakvol = cumV[1]
 peakhigh = high[1]
 peakbar = barindex[1]

 cumV = -Volume

 color = -1
 r=255
 g=0

elsif tough then

 lasttoughvol = toughvol
 lasttoughlow = toughlow
 lasttoughbar = toughbar
 toughvol = cumV[1]
 toughlow = low[1]
 toughbar = barindex[1]

 cumV = Volume

 color = 1
 r=0
 g=255

endif

//divergences finder
divbear=0
divbull=0
//bearish divergence
if(peak) then
 if peakhigh>lastpeakhigh and peakvol<lastpeakvol then
  divbear = peakvol
  drawsegment(lastpeakbar,lastpeakvol,peakbar,peakvol) coloured(r,g,0)
  drawarrowdown(peakbar,peakvol) coloured(r,g,0)
 endif
endif
//bullish divergence
if(tough) then
 if toughlow<lasttoughlow and toughvol<lasttoughvol then
  divbull = toughvol
  drawsegment(lasttoughbar,lasttoughvol,toughbar,toughvol) coloured(r,g,0)
  drawarrowup(toughbar,toughvol) coloured(r,g,0)
 endif
endif

return cumV coloured(r,g,0) style(histogram), divbear coloured(255,100,0) style(histogram), divbull coloured(100,255,0) style(histogram)
Comments
You must be logged in to post a comment.




Bonjour Nicolas, je suis tombé sur cet indicateur qui est très intéressant mais n'y -a-t il pas une erreur pour les divergences haussières? En tendance baissière, l'indicateur devrait signaler une divergence haussière lorsque le prix établit un nouveau plus bas, et que le volume cumulé est inférieur à la précédente vague baissière. Or l'indicateur indique une divergence lorsque la nouvelle vague est supérieure en volume! Cela n'est pas logique à mon sens. Serait-il possible de rectifier? Ou bien il y a peut-être quelque chose qui m'échappe?!


Bonjour et merci beaucoup Nicolas J'avais identifié et testé le code en question Mais, le code du screener étant tellement différent de celui de l'indicateur et ne comprenant pas l'italien, j'en ai déduit que le screener fourni répondait à une autre question. Et il retournait trop de résultats (1060 actions). sans critère de filtre (flèche achat / flèche vente apparue en date t ou en t-1 ou t-2). Ou bien je n'ai peut être pas bien saisi l'utilité ou l'utilisation de l'indicateur et/ou du screener? Cordialement
Ce sujet en Français et plus complet devrait t'intéresser. A noter que l'historique de ProScreener est limité à 255 bars et que les calculs commenceront donc à partir de ce moment alors que sur l'affichage graphique de l'indicateur, ils pourraient commencer beaucoup plus tôt, dépendant de la quantité d'unités affichées. Donc des différences seraient observables et par conséquent une incompréhension vis-à-vis du screener.
Bonjour, Je ne trouve pas le screener permettant d'afficher les actions qui montrent une flèche rouge ou verte sur le zigzag. J'ai pourtant cherché dans la librairie et vu votre lien mais rien qui fait ressortir cet indicateur en screener. Pourriez-vous me fournir le lien SVP ? Bonne année à tous !





Nicolas, I'd like to add a condition to the code, namely internal bar strength (IBS) < x. I tried this, but something isn't right with my syntax. Could you suggest a fix please? IBS = ( (Close - Low) / (High - Low))*100 if(peak) then if peakhigh>lastpeakhigh and peakvol<lastpeakvol and IBS<20 then endif endif

As I wrote, thanks for the help. Did't work in the ProScreener - unable to just delete what you wrote - Then, new problems appears. I guess this code isn't written as a screener, just an indicator. Would be nice to have it compatible to the screener, since your zigzag indicator looks promising...Is it possible to wish for that?I guess you are a busy man, but now you know ;)! Thanks and all the best! Chris
Bonjour nicolas. Je ne parviens pas à recopier le screener de l'indicateur. Auriez vous la gentillesse d'attache le fichier itf du screen ? merci nicolas