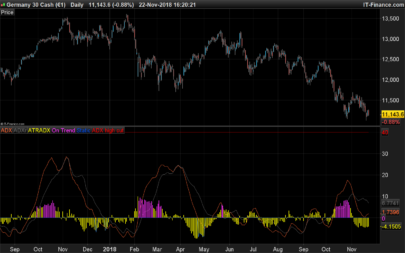
When Welles Wilder created his ADX indicator (and the Directional Movement idea) he was doing all the math by hand. You can still see the worksheets he used in his book. His way to make the Average of some numbers was just to take yesterday’s value, divide it by the period, multiply this number times period minus 1 and add today’s value divided the period. Over time this became the Wilder’s average. Since he used normally a 14-period average he was making only 4 operations instead of 15 …. and that was a lot of time saved!!
Needless to say that his average was not the most precise (I could write a lot more on averages) but it was the quickest to calculate and good enough to make his indicators to work fine.
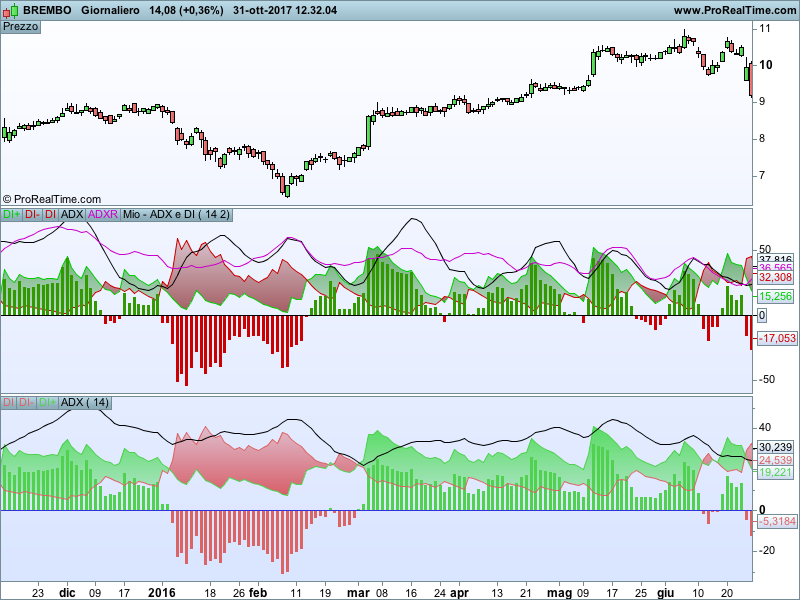
Today with the help of computers we can get much more. I wrote the directional movement code with the possibility to change the type of moving average used. I personally use a weighted moving average and the performance of Wilder’s indicator is, in my opinion and experience, much better.
Blue skies!!
|
1 2 3 4 5 6 7 8 9 10 11 12 13 14 15 16 17 18 19 20 21 22 23 24 25 26 27 |
//period=14 //mm=2 //computation of Directional Movement indicators up=high-high[1] dw=low[1]-low if up>dw and up>=0 then plusdm=up else plusdm=0 endif if dw>up and dw>=0 then mindm=dw else mindm=0 endif //computation of TR mioTR=max(abs(high-close),max(abs(low-close),range)) mioATR=average[period,MM](mioTR) //computation of DI dip=100*average[period,MM](plusdm)/mioATR dim=100*average[period,MM](mindm)/mioATR mioDI=dip-dim //computation of ADX e ADXR mioADX=100*average[period,MM](abs(dip-dim)/(dip+dim)) mioADXR=(mioADX+mioADX[14])/2 //return of data return dip coloured (0,205,0) as "DI+", dim coloured (205,0,0) as"DI-", miodi style (histogram) as "DI",mioadx as "ADX", mioadxr coloured (204,0,204) as "ADXR",0 |
Share this
No information on this site is investment advice or a solicitation to buy or sell any financial instrument. Past performance is not indicative of future results. Trading may expose you to risk of loss greater than your deposits and is only suitable for experienced investors who have sufficient financial means to bear such risk.
ProRealTime ITF files and other attachments :PRC is also on YouTube, subscribe to our channel for exclusive content and tutorials



Hi Gabri
Is there a small mistake in the TR computation: this is “mioTR=max(abs(high-close[1]),max(abs(low-close[1]),range))” in lieu of “mioTR=max(abs(high-close),max(abs(low-close),range))” ?
it’s seems correct to me https://stockcharts.com/school/doku.php?id=chart_school:technical_indicators:average_true_range_atr
I looked at your page: It’s written:
Method 2: Current High less the previous Close (absolute value)
Method 3: Current Low less the previous Close (absolute value)
This is why I think there’s a small mistake in the TR computation: this is “mioTR=max(abs(high-close[1]),max(abs(low-close[1]),range))” in lieu of “mioTR=max(abs(high-close),max(abs(low-close),range))”
You are right, I will change it, Thank you!!
Nope…I THANK YOU FOR ALL THE GOOD WORK YOU DID 😉