







Daily data for intraday timeframe
Hi all,
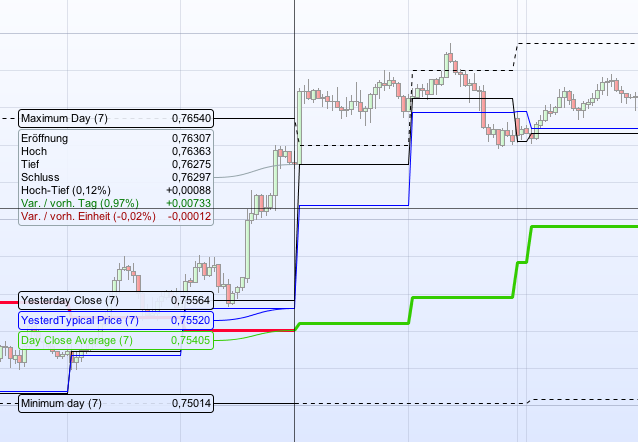
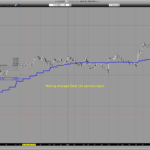
This indicator creates lines in a intraday timeframe chart:
- highest daily price
- lowest daily price
- average close price
- yesterday close
- yesterday typical price
Hope it is useful for you as for me.
//DAILY VALUES FOR INTRADAY
//Author: LEO
//Variable as input: D
D = 20

once DayAverage=Dclose(1)
once DAYHIGHER=Dhigh(1)
once DAYLOWER=Dlow(1)

DAYCLOSE=Dclose(1)
TYPICALDAY=(DHIGH(1)+DLOW(1)+DAYCLOSE)/3

IF TYPICALDAY <> TYPICALDAY[1] THEN
 DayAverage=0
 DAYHIGHER=Dhigh(1)
 DAYLOWER=Dlow(1)
 FOR i=1 to D DO
  DayAverage=DCLOSE(i)+DayAverage
  DAYHIGHER=max(DAYHIGHER,Dhigh(i))
  DAYLOWER=min(DAYLOWER,Dlow(i))
 NEXT
 DayAverage=DayAverage/D
ENDIF

return DayAverage as "Day Close Average", DAYCLOSE as "Yesterday Close", TYPICALDAY as "YesterdTypical Price", DAYLOWER as "Minimum day", DAYHIGHER as "Maximum Day"
Comments
You must be logged in to post a comment.



//DAILY VALUES FOR INTRADAY v1.1 //Author: LEO //Variable as input: DAYS once DAYHIGHER=Dhigh(1) once DAYLOWER=Dlow(1) once DayAverage=DCLOSE(i) DAYCLOSE=Dclose(1) TYPICALDAY=(DHIGH(1)+DLOW(1)+DAYCLOSE)/3 IF TYPICALDAY TYPICALDAY[1] and DayOfWeek >= 1 THEN DayAverage0=0 DAYHIGHER=Dhigh(1) DAYLOWER=Dlow(1) FOR i=1 to D-1 DO DayAverage0=DCLOSE(i)+DayAverage0 DAYHIGHER=max(DAYHIGHER,Dhigh(i)) DAYLOWER=min(DAYLOWER,Dlow(i)) NEXT i=DayOfWeek ii=0 WHILE i = 1 THEN DayAverage=(DayAverage0+close)/(D-ii) ENDIF return DayAverage as "Day Close Average", DAYCLOSE as "Yesterday Close", TYPICALDAY as "YesterdTypical Price", DAYLOWER as "Minimum day", DAYHIGHER as "Maximum Day"

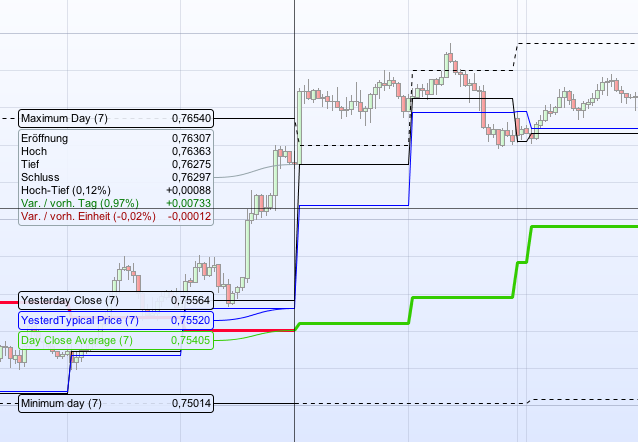
..for some reason I can not add PRT code properly... anyway