

Daily Fibonacci Percent
December 17, 2018, 11:16 AM
Indicators
5 Comments
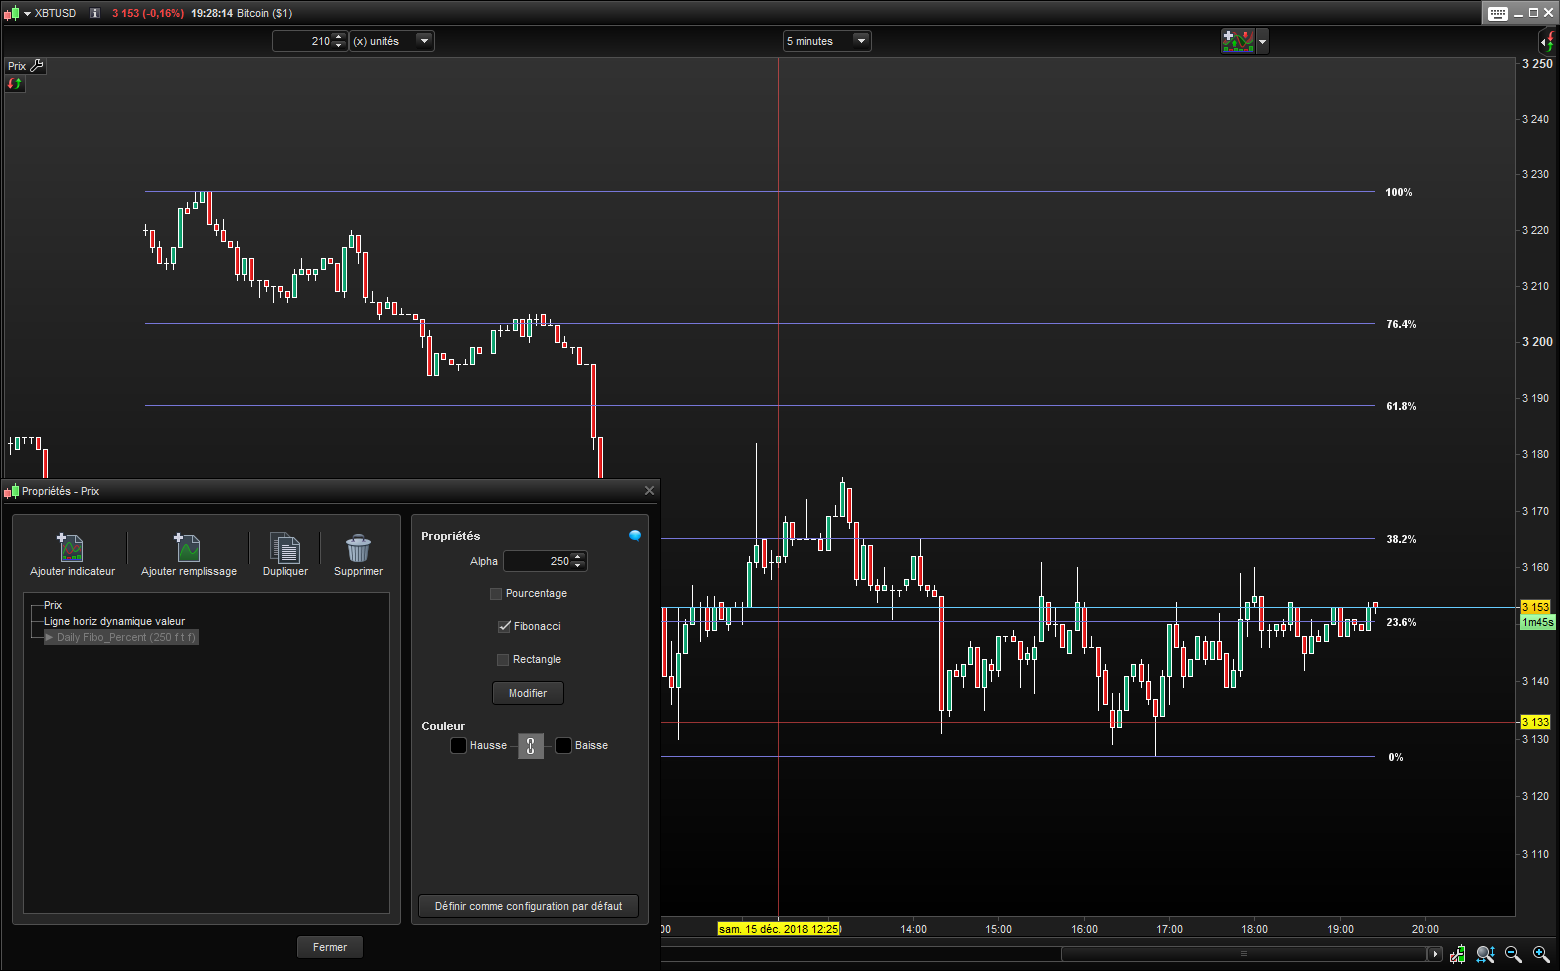
A new way to understand markets with this program that can be used on any asset and on time units from “tick by tick” until 4 hours. This does not prevent it from being a very good “thermometer” for daily, weekly or monthly units by zooming out to the maximum (or with other opened price charts window) …
It allows to visualize the price evolution calculated from the real time levels and to draw segments by range of 20 in 20% while providing the remarkable numbers of the Fibonacci sequence, it also indicates the level of opening.
Four variables are available in settings, for:
- Adjust transparency of information
- Hide General Rectangle
- Hide Percent
- Hide the Fibonacci. All that can be mixed in his sauce …
// Daily Fibo_Percent | Graph Indicator
// 15.12.2018
// Swapping @ www.forexswap.fr
// Sharing ProRealTime knowledge (alt+16)

DefParam DrawOnLastBarOnly = true

// --- settings
rectangle = 1 //(0=false;1=true)
pourcentage = 1 //(0=false;1=true)
fibonacci = 1 //(0=false;1=true)
alpha = 255
// --- end of settings

if day <> day[1] then
 startbar = barindex
endif

HiDay = dhigh(0)
LowDay = dlow(0)
if rectangle = 1 then
 DrawRectangle(startbar,HiDay,barindex,LowDay) coloured(123,0,0,alpha)
else
 rectangle = 0
endif
DrawText("                ◄ Open",barindex,dopen(0),Dialog,Bold,11) coloured(250,150,100,alpha)

if pourcentage = 1 then
 pourcentage100 = (hiday-lowday)*1.0+lowday
 DrawSegment(startbar,pourcentage100,barindex,pourcentage100) coloured(150,200,50,alpha)
 DrawText("             ◄ 100%",barindex,pourcentage100,Dialog,Bold,11) coloured(150,200,50,alpha)
 pourcentage80 = (hiday-lowday)*.80+lowday
 DrawSegment(startbar,pourcentage80,barindex,pourcentage80) coloured(150,200,50,alpha)
 DrawText("               80%",barindex,pourcentage80,Dialog,Bold,11) coloured(150,200,50,alpha)
 pourcentage60 = (hiday-lowday)*.6+lowday
 DrawSegment(startbar,pourcentage60,barindex,pourcentage60) coloured(150,200,50,alpha)
 DrawText("               60%",barindex,pourcentage60,Dialog,Bold,11) coloured(150,200,50,alpha)
 pourcentage40 = (hiday-lowday)*.4+lowday
 DrawSegment(startbar,pourcentage40,barindex,pourcentage40) coloured(150,200,50,alpha)
 DrawText("               40%",barindex,pourcentage40,Dialog,Bold,11) coloured(150,200,50,alpha)
 pourcentage20 = (hiday-lowday)*.2+lowday
 DrawSegment(startbar,pourcentage20,barindex,pourcentage20) coloured(150,200,50,alpha)
 DrawText("               20%",barindex,pourcentage20,Dialog,Bold,11) coloured(150,200,50,alpha)
 pourcentage0 = (hiday-lowday)*.0+lowday
 DrawSegment(startbar,pourcentage0,barindex,pourcentage0) coloured(150,200,50,alpha)
 DrawText("         ◄ 0%",barindex,pourcentage0,Dialog,Bold,11) coloured(150,200,50,alpha)
else
 pourcentage = 0
endif

if fibonacci = 1 then
 fib100 = (hiday-lowday)*1.0+lowday
 DrawSegment(startbar,fib100,barindex,fib100) coloured(234,234,234,alpha)
 DrawText("             ◄ 100%",barindex,fib100,Dialog,Bold,11) coloured(234,234,234,alpha)
 fib764 = (hiday-lowday)*.764+lowday
 DrawSegment(startbar,fib764,barindex,fib764) coloured(234,234,234,alpha)
 DrawText("                  76.4%",barindex,fib764,Dialog,Bold,11) coloured(234,234,234,alpha)
 fib618 = (hiday-lowday)*.618+lowday
 DrawSegment(startbar,fib618,barindex,fib618) coloured(234,234,234,alpha)
 DrawText("                  61.8%",barindex,fib618,Dialog,Bold,11) coloured(234,234,234,alpha)
 fib382 = (hiday-lowday)*.382+lowday
 DrawSegment(startbar,fib382,barindex,fib382) coloured(234,234,234,alpha)
 DrawText("                  38.2%",barindex,fib382,Dialog,Bold,11) coloured(234,234,234,alpha)
 fib236 = (hiday-lowday)*.236+lowday
 DrawSegment(startbar,fib236,barindex,fib236) coloured(234,234,234,alpha)
 DrawText("                  23.6%",barindex,fib236,Dialog,Bold,11) coloured(234,234,234,alpha)
 fib0 = (hiday-lowday)*.0+lowday
 DrawSegment(startbar,fib0,barindex,fib0) coloured(234,234,234,alpha)
 DrawText("         ◄ 0%",barindex,fib0,Dialog,Bold,11) coloured(234,234,234,alpha)
else
 fibonacci = 0
endif

return
Happy New Year holidays 2018 to all
Swapping
Download
Filename:
Daily-Fibo_Percent.itf
Downloads:
399
Master
<a href="http://www.forexswap.fr/">Le trading</a> une discipline sans faille qui en décourage plus d'un ! "Et pourtant..."
Author’s Profile
Loading...