-
1. Purpose and Context
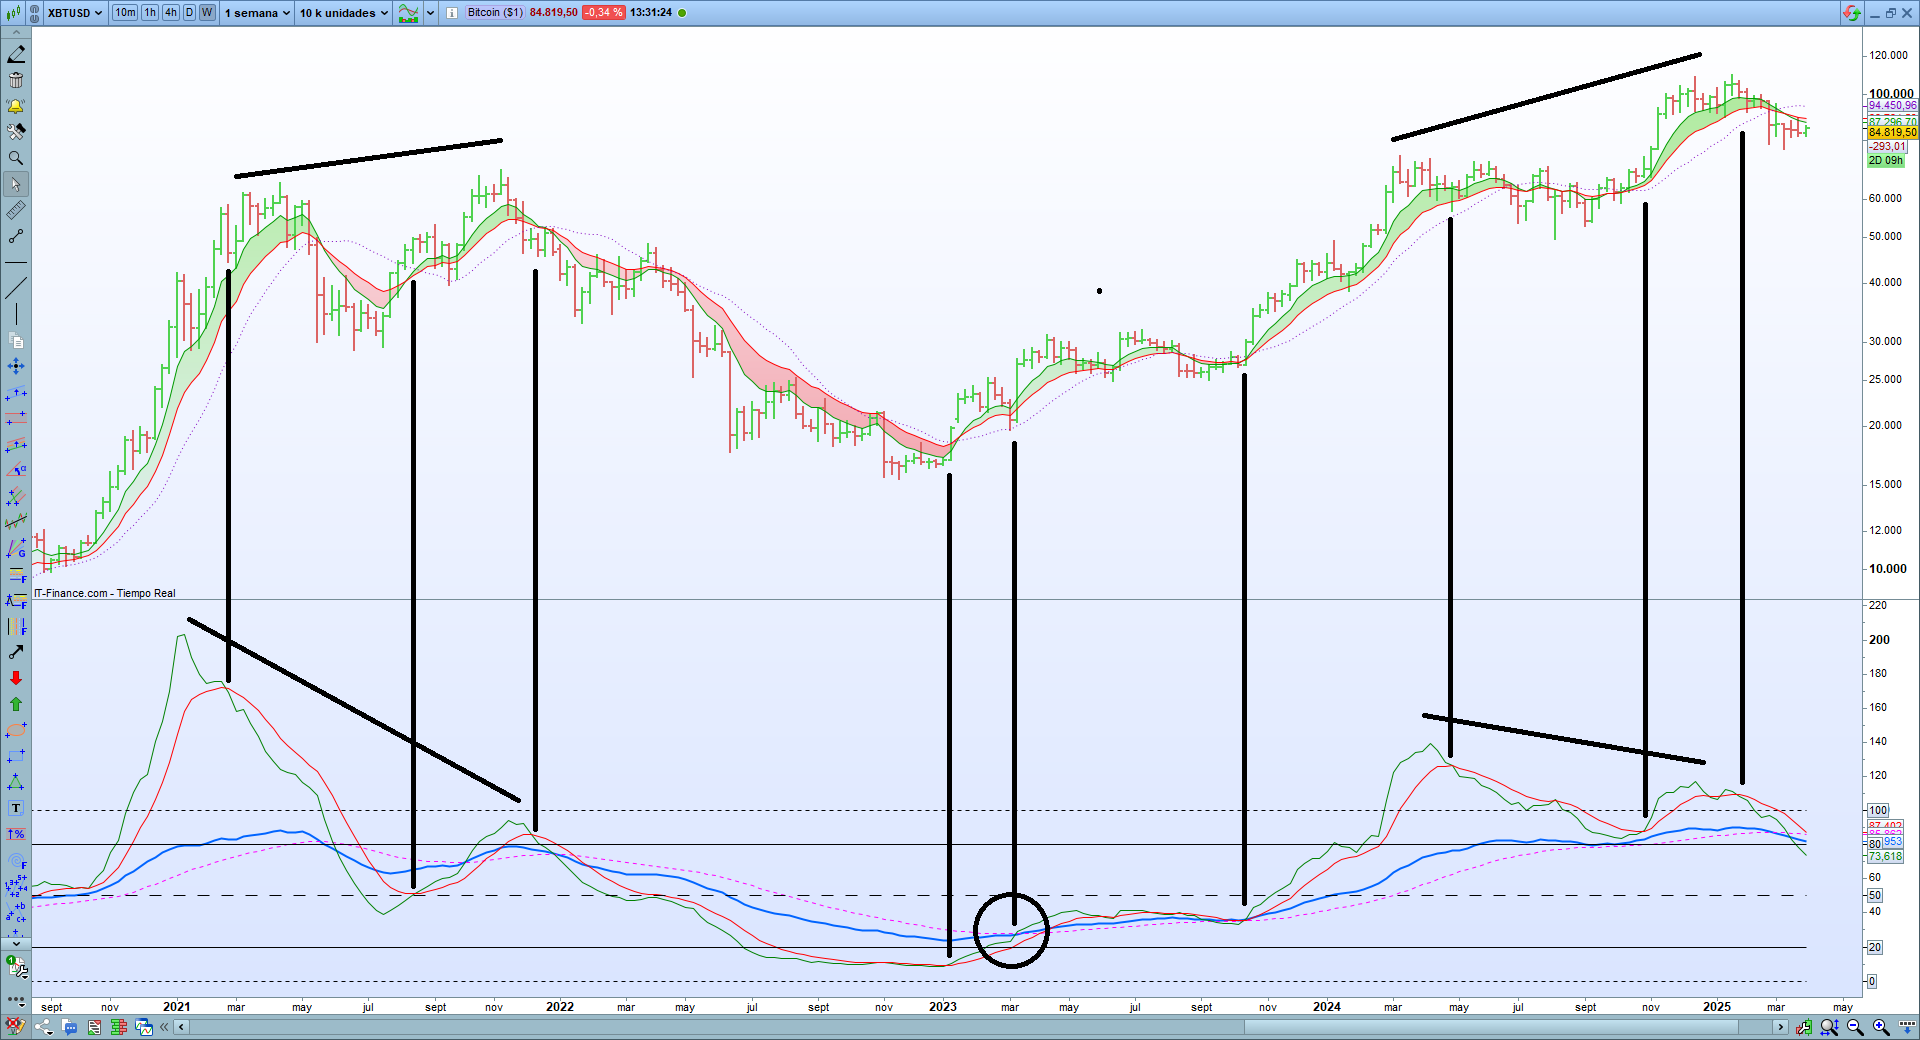
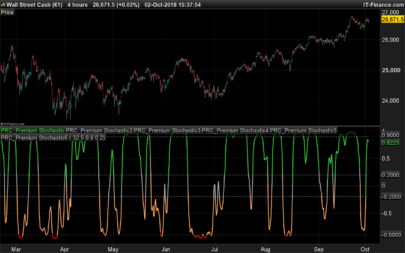
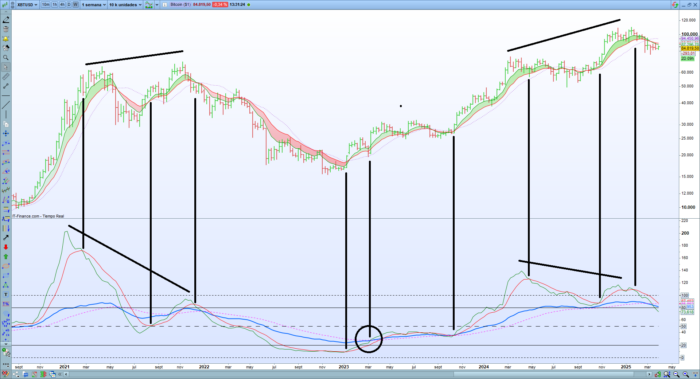
This oscillator, developed by mboliart (https://x.com/mboliart), is an evolution of the classic stochastic indicator, optimized for instruments with high volatility. Version 2.0 incorporates a volatility adjustment based on the Average True Range (ATR), making it more adaptable to sharp price movements, such as those seen in Bitcoin and DAX40. Its name, DELOREAN sto SC-SV, reflects its ability to “navigate” through market conditions (SC for overbought and SV for oversold). -
2. Configurable Parameters
The indicator uses several predefined parameters for its calculations:-
Period = 200: The range of bars used to calculate historical price highs and lows.
-
K = 20: The period for the exponential moving average of the K line.
-
D = 20: The period for the exponential moving average of the D line.
-
N = 8: The period for the exponential moving average applied to the adjusted J line.
-
ATRPeriod = 14: The period used to calculate the ATR, which measures recent volatility.
-
-
3. Calculation of the Base Oscillator
The base oscillator measures the position of the closing price (CLOSE) within the price range of the last 200 bars:-
The highest (masalto = HIGHEST[Period](HIGH)) and lowest (masbajo = LOWEST[Period](LOW)) prices over 200 bars are calculated.
-
The oscillator is obtained using the formula:
oscilador = (CLOSE – masbajo) / (masalto – masbajo) * 100
This produces a value between 0 and 100, where 0 indicates the price is at its historical low and 100 at its historical high.
-
-
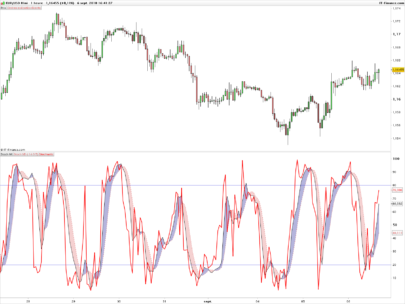
4. Main Lines (K, D, and J)
From the base oscillator, three main lines are generated:-
K Line (%K): An exponential moving average of 20 periods applied to the base oscillator (liniaK = ExponentialAverage[K](oscilador)), smoothing out price fluctuations. It is displayed in blue with a thickness of 2.
-
D Line (%D): An exponential moving average of 20 periods applied to the K line (liniaD = ExponentialAverage[D](liniaK)), acting as a slower signal. It is displayed in magenta with a dotted line style.
-
J Line: Calculated as liniaJ = 3 * liniaK – 2 * liniaD, a formula that amplifies the divergence between K and D, making it sensitive to potential reversals. In this version, J is adjusted for volatility (see the next point).
-
-
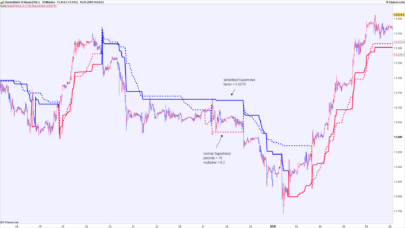
5. Volatility Adjustment (Adjusted J Line)
To make the oscillator more effective in volatile markets, the J line is adjusted using the Average True Range (ATR):-
The ATR is calculated over a 14-bar period: atr = AverageTrueRange[ATRPeriod](CLOSE).
-
The ATR is normalized by dividing it by its 14-period exponential moving average: factorvolatilidad = atr / atrmedia.
-
The adjusted J line is obtained as: liniaJvol = liniaJ * factorvolatilidad.
This means that during periods of high volatility, J is amplified, and during low volatility, it is reduced, improving its sensitivity to market conditions. The adjusted J line is displayed in green.
-
-
6. EMA of the Adjusted J Line
To smooth the adjusted J line and facilitate the identification of crossover signals, an 8-period exponential moving average is calculated:-
emaJNvol = ExponentialAverage[N](liniaJvol).
This line, known as EMA CRUCE SC/SV, is displayed in red and is useful for confirming trends or detecting crossovers with the adjusted J line.
-
-
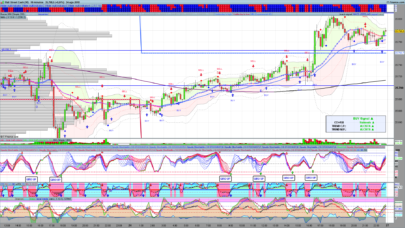
7. Reference Levels
The oscillator includes static levels to aid interpretation:-
L100 = 100: Maximum level, indicating extreme overbought conditions (dotted line).
-
L80 = 80: Overbought level (solid line).
-
L50 = 50: Neutral level (dotted line).
-
L20 = 20: Oversold level (solid line).
-
L0 = 0: Minimum level, indicating extreme oversold conditions (dotted line).
These levels help traders identify key zones on the chart.
-
-
8. Visualization
The indicator returns the following lines with specific styles and colors:-
%K (blue, thickness 2, solid line).
-
%D (magenta, dotted line).
-
%J adjusted (green, solid line).
-
EMA CRUCE SC/SV (red, solid line).
-
Reference levels (L100, L80, L50, L20, L0) with varied styles (dotted or solid) for easy distinction.
-
-
9. Practical Application
The DELOREAN sto SC-SV v.2.0 oscillator is ideal for:-
Detecting overbought conditions (J near 80-100) and oversold conditions (J near 0-20).
-
Identifying potential reversals through crossovers between the adjusted J line and its EMA.
-
Adapting to volatile markets thanks to the ATR adjustment, making it particularly useful for Bitcoin and DAX40.
-
The DELOREAN sto SC-SV v.2.0 is an advanced oscillator for ProRealTime that combines a classic stochastic calculation with a volatility adjustment based on the ATR. It uses a 200-bar range to measure price position, generates K, D, and J lines (the latter adjusted for volatility), and adds an EMA of J for crossover signals. With reference levels (0, 20, 50, 80, 100), it helps identify overbought and oversold conditions in volatile markets like Bitcoin and DAX40, providing a flexible and visually clear tool for traders.
|
1 2 3 4 5 6 7 8 9 10 11 12 13 14 15 16 17 18 19 20 21 22 23 24 25 26 27 28 29 30 31 32 33 34 35 36 37 38 39 40 41 42 43 44 45 |
// Desarrollado por mboliart - https://x.com/mboliart // Versión v.2.0: [02/04/2025] // K=Periodo=200 (azul) // D=Señal=20 (rojo) // J=divergencia=20 (verde) - Ajustada por volatilidad // K y D funcionan juntos // Sobrecompra = J ajustada - Interpretar con emaJ8 // Parámetros Period = 200 K = 20 D = 20 N = 8 // Período para la EMA de J ATRPeriod = 14 // Cálculo del oscilador masalto = HIGHEST[Period](HIGH) masbajo = LOWEST[Period](LOW) oscilador = (CLOSE - masbajo) / (masalto - masbajo) * 100 // Cálculo de las líneas K, D y J liniaK = ExponentialAverage[K](oscilador) liniaD = ExponentialAverage[D](liniaK) liniaJ = 3 * liniaK - 2 * liniaD // Cálculo del ATR y factor de volatilidad atr = AverageTrueRange[ATRPeriod](CLOSE) atrmedia = ExponentialAverage[ATRPeriod](atr) factorvolatilidad = atr / atrmedia // Ajuste de J por volatilidad liniaJvol = liniaJ * factorvolatilidad // Cálculo de la EMA de J ajustada emaJNvol = ExponentialAverage[N](liniaJvol) // Líneas de referencia L100 = 100 L80 = 80 L50 = 50 L20 = 20 L0 = 0 // Retornar las líneas RETURN liniaK AS "%K" coloured(0,100,255) style(line,2),liniaD AS "%D" coloured(255,0,255) STYLE(DOTTEDLINE),liniaJvol AS "%J ajustada" coloured(0,128,0),emaJNvol coloured(255,0,0) AS "EMA CRUCE SC/SV" style(LINE),L100 AS "L100" style(dottedline,1),L80 AS "L80" style(line,1),L50 AS "L50" style(dottedline2,1),L20 AS "L20" style(line,1),L0 AS "L0" style(dottedline,1) |
Share this
No information on this site is investment advice or a solicitation to buy or sell any financial instrument. Past performance is not indicative of future results. Trading may expose you to risk of loss greater than your deposits and is only suitable for experienced investors who have sufficient financial means to bear such risk.
ProRealTime ITF files and other attachments :
Find other exclusive trading pro-tools on ![]()
PRC is also on YouTube, subscribe to our channel for exclusive content and tutorials