Introduction
Double Top and Double Bottom patterns are technical analysis figures that indicate potential reversal points in an asset’s price direction. Accurately identifying these patterns can offer traders opportunities for market entry and exit with high success potential.
In this article, we will explore how to use an indicator developed to automatically detect these patterns on the chart, making it easier to identify these critical reversal points.
What is the Double Top / Bottom Indicator?
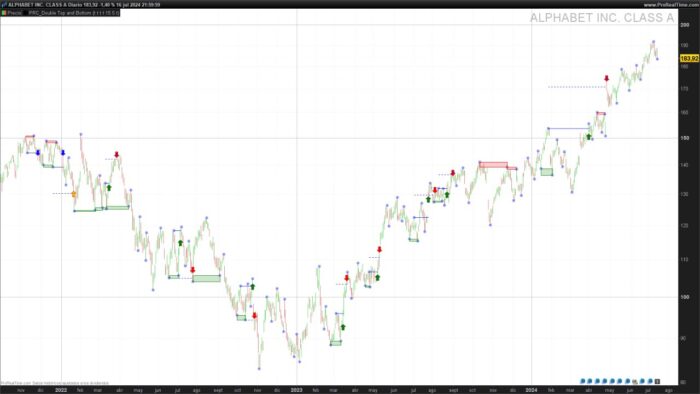
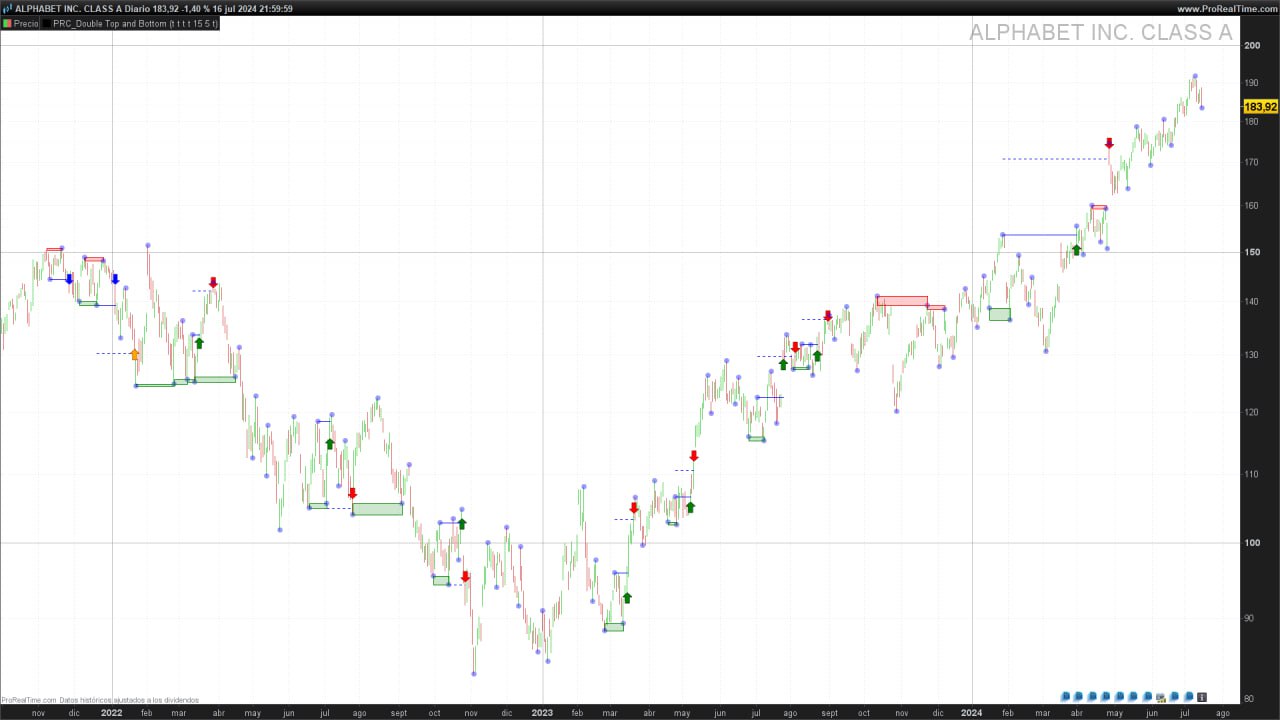
The Double Top / Bottom indicator aims to automatically detect these patterns on the chart. This indicator is especially useful for traders looking to identify potential reversal points in the market without the need to manually search for these patterns. The indicator scans the chart for formations that meet the criteria of a Double Top or Double Bottom and visually marks them on the chart for easy identification.
Indicator Configuration
The Double Top / Bottom indicator allows the customization of several parameters to suit the specific needs of each trader. Below are the input parameters of the indicator:
prd: Period used to search for pivots. This value determines how many bars will be considered to identify the highs and lows on the chart. The default value is 5.tol: Tolerance for pattern validation. This parameter defines the tolerance range within which the peaks must be to be considered part of the same pattern. The default value is 15.showPivot: Option to show detected pivots on the chart.Show2Bot: Option to show Double Bottom patterns on the chart.Show2Top: Option to show Double Top patterns on the chart.ShowShort: Option to show short (sell) signals on the chart.ShowLong: Option to show long (buy) signals on the chart.
These parameters allow adjusting the indicator’s behavior to suit different trading strategies and market conditions.
Calculating Pivots
The first step of the indicator is to identify the high and low pivots on the chart. These pivots are used to determine the market direction and to identify potential Double Top and Double Bottom patterns.
Identifying Pivots
The high (ph) and low (pl) pivots are identified using the maximum and minimum values within the defined period (prd). This calculation is performed using the following lines of code:
|
1 2 |
ph = high=highest[prd](high) pl = low=lowest[prd](low) |
Calculating Market Direction
The market direction is determined based on changes in these pivots. If a new high pivot is detected and there is no recent low pivot, the direction is assumed to be bullish. If a new low pivot is detected and there is no recent high pivot, the direction is assumed to be bearish.
|
1 2 3 4 5 6 7 8 |
if ph and pl=0 then dir=1 elsif pl and ph=0 then dir=-1 else dir=dir endif dirchanged=dir<>dir[1] |
This approach allows the indicator to dynamically adapt its behavior based on changes in market prices.
Constructing the Zigzag
The next step in the development of the indicator is the construction of the zigzag, which connects the identified high and low pivots on the chart. This algorithm is crucial for forming the basis of the Double Top and Double Bottom pattern analysis.
Storing Relevant Points
The indicator uses arrays to store the relevant points of the zigzag. Each time a change in market direction is detected, a new point is added to the zigzag. The code below shows how this operation is performed:
|
1 2 3 4 5 6 7 8 9 10 11 12 13 14 15 16 17 18 19 20 21 22 23 |
if ph or pl then if dirchanged then if dir=1 then $zigzag[t+1]=highest[prd](high) $zigzagidx[t+1]=barindex $dir[t+1]=1 t=t+1 elsif dir=-1 then $zigzag[t+1]=lowest[prd](low) $zigzagidx[t+1]=barindex $dir[t+1]=-1 t=t+1 endif else if dir=1 and highest[prd](high)> $zigzag[t] then $zigzag[t]=highest[prd](high) $zigzagidx[t]=barindex elsif dir=-1 and lowest[prd](low)< $zigzag[t] then $zigzag[t]=lowest[prd](low) $zigzagidx[t]=barindex endif endif endif |
The $zigzag array stores the pivot values, while the $zigzagidx array stores the corresponding bar indices. This structure allows the indicator to track price movements and determine key turning points.
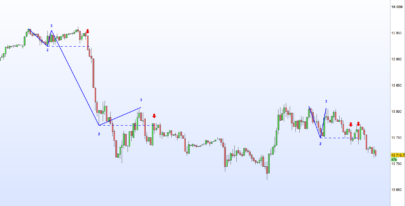
Detecting Double Top Patterns
A Double Top pattern is a bearish reversal formation that occurs after an uptrend. A Double Top pattern is considered to have occurred when specific price conditions are met.
Calculating Validation Levels
To validate a Double Top pattern, two levels are calculated: TopHigh and BotHigh. These levels are used to determine if the identified peaks are close enough to be considered part of the same pattern.
|
1 2 3 4 |
htop=($zigzag[t-3]+$zigzag[t-1])/2-$zigzag[t-2] TopHigh=$zigzag[t-3]+htop*tol/100 BotHigh=$zigzag[t-3]-htop*tol/100 DoubleTop=($zigzag[t-1]>=BotHigh and $zigzag[t-1]<=TopHigh) and ($zigzag[t-3]>y1 and $zigzag[t-3]>$zigzag[t-2] and $zigzag[t-1]>$zigzag[t-2]) |
Pattern Validation
Once the levels are calculated, the indicator validates whether the pattern meets the Double Top conditions. If a valid pattern is detected, it is visually marked on the chart, and short entry signals are generated.
|
1 2 3 4 5 6 7 8 9 10 11 12 13 14 15 16 17 18 |
if DoubleTop and not DoubleTop[1] then checkTop=1 short=0 x1=$zigzagidx[t-4] y1=$zigzag[t-4] x2=$zigzagidx[t-3] y2=$zigzag[t-3] x3=$zigzagidx[t-2] y3=$zigzag[t-2] x4=$zigzagidx[t-1] y4=$zigzag[t-1] x5=$zigzagidx[t] y5=$zigzag[t] dist=abs(y3-min(y2,y4)) if Show2Top then drawrectangle(x2,y2,x4,y4)coloured("red")fillcolor("red",50) endif endif |
Generating Short Signals
The indicator also includes logic to generate sell signals when a Double Top pattern is confirmed. These signals help traders make informed decisions on when to exit long positions or enter short positions.
|
1 2 3 4 5 6 7 8 9 10 11 12 13 14 15 16 17 18 19 20 21 |
if checkTop and ShowShort then if not short and close crosses under y3 then short=1 tpsh=(y3-dist) slsh=max(y2,y4) drawarrowdown(barindex,high)coloured("blue") drawsegment(x3,y3,barindex,y3)coloured("blue") endif if short and low crosses under tpsh then short=0 checkTop=0 Drawsegment(x3,tpsh,barindex,tpsh)coloured("blue")style(dottedline) drawarrowup(barindex,low)coloured("orange") endif if short and close crosses over slsh then checkTop=0 short=0 Drawsegment(x4,slsh,barindex,slsh)coloured("blue")style(dottedline) drawarrowup(barindex,low)coloured("orange") endif endif |
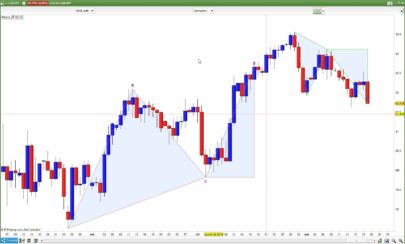
Detecting Double Bottom Patterns
A Double Bottom pattern is a bullish reversal formation that occurs after a downtrend. This pattern is considered valid when specific price conditions are met, similar to the Double Top but in the opposite direction.
Calculating Validation Levels
To validate a Double Bottom pattern, two levels are calculated: topLow and botLow. These levels are used to determine if the identified valleys are close enough to be considered part of the same pattern.
|
1 2 3 4 |
hbot=$zigzag[t-2]-($zigzag[t-3]+$zigzag[t-1])/2 topLow=$zigzag[t-3]+hbot*tol/100 botLow=$zigzag[t-3]-hbot*tol/100 DoubleBot=($zigzag[t-1]>=botLow and $zigzag[t-1]<=toplow) and ($zigzag[t-3]<$zigzag[t-4] and $zigzag[t-3]<$zigzag[t-2] and $zigzag[t-1]<$zigzag[t-2]) |
Pattern Validation
Once the levels are calculated, the indicator validates whether the pattern meets the Double Bottom conditions. If a valid pattern is detected, it is visually marked on the chart, and long entry signals are generated.
|
1 2 3 4 5 6 7 8 9 10 11 12 13 14 15 16 17 |
if DoubleBot and not DoubleBot[1] then checkBot=1 xx1=$zigzagidx[t-4] yy1=$zigzag[t-4] xx2=$zigzagidx[t-3] yy2=$zigzag[t-3] xx3=$zigzagidx[t-2] yy3=$zigzag[t-2] xx4=$zigzagidx[t-1] yy4=$zigzag[t-1] xx5=$zigzagidx[t] yy5=$zigzag[t] dist1=abs(yy3-min(yy2,yy4)) if Show2Bot then drawrectangle(xx2,yy2,xx4,yy4)coloured("green")fillcolor("green",50) endif endif |
Generating Long Signals
The indicator also includes logic to generate buy signals when a Double Bottom pattern is confirmed. These signals help traders make informed decisions on when to exit short positions or enter long positions.
|
1 2 3 4 5 6 7 8 9 10 11 12 13 14 15 16 17 18 19 20 21 |
if checkbot and ShowLong then if not long and close crosses over yy3 then long=1 tp=yy3+dist1 sl=min(yy2,yy4) drawarrowup(barindex,low)coloured("green") drawsegment(xx3,yy3,barindex,yy3)coloured("blue") endif if long and high crosses over tp then long=0 checkBot=0 Drawsegment(xx3,tp,barindex,tp)coloured("blue")style(dottedline) drawarrowdown(barindex,high)coloured("red") endif if long and close crosses under sl then checkBot=0 long=0 Drawsegment(xx4,sl,barindex,sl)coloured("blue")style(dottedline) drawarrowdown(barindex,high)coloured("red") endif endif |
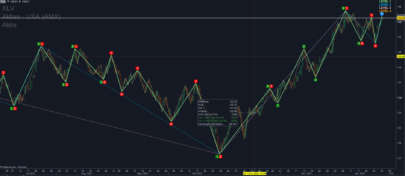
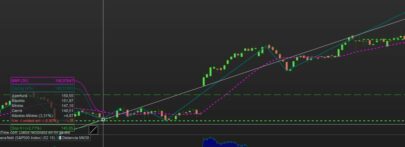
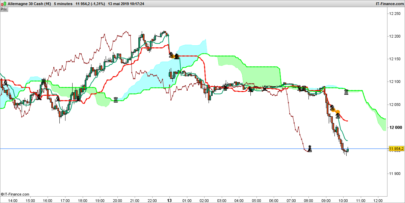
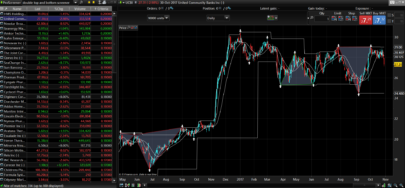
Chart Visualization
The Double Top / Double Bottom indicator includes several visualization functions to mark the pivots and detected patterns directly on the chart. This provides a clear visual representation and helps traders quickly identify critical reversal points.
Drawing Pivots
For each identified pivot, the indicator draws a point on the chart. This is done using the drawpoint function.
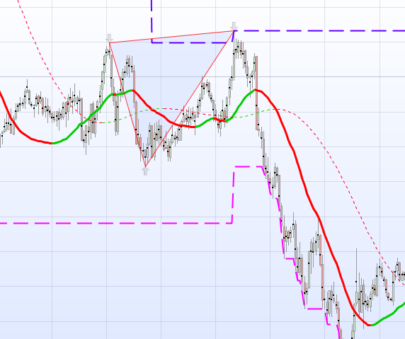
Drawing Patterns
When a Double Top or Double Bottom pattern is detected, the indicator draws a rectangle around the relevant peaks or valleys. This helps to clearly visualize the pattern formation on the chart.
Buy and Sell Signals
In addition to the patterns, the indicator draws arrows on the chart to signal entry and exit points based on the signals generated by the Double Top and Double Bottom patterns.
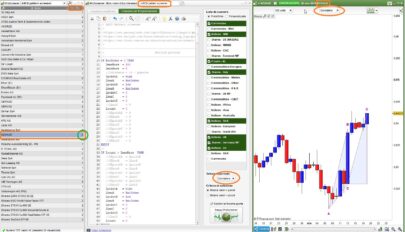
Indicator Code
Below is the complete code for the indicator in ProBuilder:
|
1 2 3 4 5 6 7 8 9 10 11 12 13 14 15 16 17 18 19 20 21 22 23 24 25 26 27 28 29 30 31 32 33 34 35 36 37 38 39 40 41 42 43 44 45 46 47 48 49 50 51 52 53 54 55 56 57 58 59 60 61 62 63 64 65 66 67 68 69 70 71 72 73 74 75 76 77 78 79 80 81 82 83 84 85 86 87 88 89 90 91 92 93 94 95 96 97 98 99 100 101 102 103 104 105 106 107 108 109 110 111 112 113 114 115 116 117 118 119 120 121 122 123 124 125 126 127 128 129 130 131 132 133 134 135 136 137 138 139 140 141 142 143 144 145 146 147 148 149 150 151 152 153 154 155 156 157 158 159 160 161 162 163 |
//----------------------------------------------------------// //PRC_Double Top and Bottom //version = 0 //16.07.2024 //Iván González @ www.prorealcode.com //Sharing ProRealTime knowledge //----------------------------------------------------------// //-----inputs prd = 5 tol = 15 showPivot=1 Show2Bot=1 Show2Top=1 ShowShort=1 ShowLong=1 src1 = low src2 = high //----------------------------------------------------------// //-----Pivots High&Low--------------------------------------// ph = high=highest[prd](high) pl = low=lowest[prd](low) //----------------------------------------------------------// //-----Direction Calculation--------------------------------// if ph and pl=0 then dir=1 elsif pl and ph=0 then dir=-1 else dir=dir endif dirchanged=dir<>dir[1] //----------------------------------------------------------// //-----Calculate Arrays for each pivot----------------------// if ph or pl then if dirchanged then if dir=1 then $zigzag[t+1]=highest[prd](high) $zigzagidx[t+1]=barindex $dir[t+1]=1 t=t+1 elsif dir=-1 then $zigzag[t+1]=lowest[prd](low) $zigzagidx[t+1]=barindex $dir[t+1]=-1 t=t+1 endif else if dir=1 and highest[prd](high)> $zigzag[t] then $zigzag[t]=highest[prd](high) $zigzagidx[t]=barindex elsif dir=-1 and lowest[prd](low)< $zigzag[t] then $zigzag[t]=lowest[prd](low) $zigzagidx[t]=barindex endif endif endif //----------------------------------------------------------// if t>4 then //-----Double Top pattern----------------------------// htop=($zigzag[t-3]+$zigzag[t-1])/2-$zigzag[t-2] TopHigh=$zigzag[t-3]+htop*tol/100 BotHigh=$zigzag[t-3]-htop*tol/100 DoubleTop=($zigzag[t-1]>=BotHigh and $zigzag[t-1]<=TopHigh) and ($zigzag[t-3]>y1 and $zigzag[t-3]>$zigzag[t-2] and $zigzag[t-1]>$zigzag[t-2]) if DoubleTop and not DoubleTop[1] then checkTop=1 short=0 x1=$zigzagidx[t-4] y1=$zigzag[t-4] x2=$zigzagidx[t-3] y2=$zigzag[t-3] x3=$zigzagidx[t-2] y3=$zigzag[t-2] x4=$zigzagidx[t-1] y4=$zigzag[t-1] x5=$zigzagidx[t] y5=$zigzag[t] dist=abs(y3-min(y2,y4)) if Show2Top then drawrectangle(x2,y2,x4,y4)coloured("red")fillcolor("red",50) endif endif if checkTop and ShowShort then if not short and close crosses under y3 then short=1 tpsh=(y3-dist) slsh=max(y2,y4) drawarrowdown(barindex,high)coloured("blue") drawsegment(x3,y3,barindex,y3)coloured("blue") endif if short and low crosses under tpsh then short=0 checkTop=0 Drawsegment(x3,tpsh,barindex,tpsh)coloured("blue")style(dottedline) drawarrowup(barindex,low)coloured("orange") endif if short and close crosses over slsh then checkTop=0 short=0 Drawsegment(x4,slsh,barindex,slsh)coloured("blue")style(dottedline) drawarrowup(barindex,low)coloured("orange") endif endif //-----Double Bottom pattern------------------------// hbot=$zigzag[t-2]-($zigzag[t-3]+$zigzag[t-1])/2 topLow=$zigzag[t-3]+hbot*tol/100 botLow=$zigzag[t-3]-hbot*tol/100 DoubleBot=($zigzag[t-1]>=botLow and $zigzag[t-1]<=toplow) and ($zigzag[t-3]<$zigzag[t-4] and $zigzag[t-3]<$zigzag[t-2] and $zigzag[t-1]<$zigzag[t-2]) if DoubleBot and not DoubleBot[1] then checkBot=1 xx1=$zigzagidx[t-4] yy1=$zigzag[t-4] xx2=$zigzagidx[t-3] yy2=$zigzag[t-3] xx3=$zigzagidx[t-2] yy3=$zigzag[t-2] xx4=$zigzagidx[t-1] yy4=$zigzag[t-1] xx5=$zigzagidx[t] yy5=$zigzag[t] dist1=abs(yy3-min(yy2,yy4)) if Show2Bot then drawrectangle(xx2,yy2,xx4,yy4)coloured("green")fillcolor("green",50) endif endif if checkbot and ShowLong then if not long and close crosses over yy3 then long=1 tp=yy3+dist1 sl=min(yy2,yy4) drawarrowup(barindex,low)coloured("green") drawsegment(xx3,yy3,barindex,yy3)coloured("blue") endif if long and high crosses over tp then long=0 checkBot=0 Drawsegment(xx3,tp,barindex,tp)coloured("blue")style(dottedline) drawarrowdown(barindex,high)coloured("red") endif if long and close crosses under sl then checkBot=0 long=0 Drawsegment(xx4,sl,barindex,sl)coloured("blue")style(dottedline) drawarrowdown(barindex,high)coloured("red") endif endif endif //-----Draw Pivots------------------------------------------// if islastbarupdate and showPivot then for i=t downto 4 do drawpoint($zigzagidx[i],$zigzag[i],2)coloured("blue",100) next endif //----------------------------------------------------------// return |
Conclusion
The Double Top / Double Bottom indicator is a powerful tool for detecting reversal patterns in the market. With its ability to visualize these patterns on the chart and provide entry and exit signals, it can be a valuable addition to any trader’s toolkit.
Share this
No information on this site is investment advice or a solicitation to buy or sell any financial instrument. Past performance is not indicative of future results. Trading may expose you to risk of loss greater than your deposits and is only suitable for experienced investors who have sufficient financial means to bear such risk.
ProRealTime ITF files and other attachments :
Find other exclusive trading pro-tools on ![]()
PRC is also on YouTube, subscribe to our channel for exclusive content and tutorials


Hola Iván muchas gracias por todo tu trabajo y por tus videos. Estoy dado de alta en la plataforma y en breve voy a cambiar del banco donde estoy a vuestra plataforma. ¿Me podrás echar un cable? ¿Podré usar tus programaciones para operar? Gracias de antemano.
Hola javier
gracias! es importante realizar buenos backtest antes de lanzarse al mercado y aplicar una correcta gestión de capital para no pillarse los dedos.
I have an error with “fillcolor” – How to solve this? / J’ai une erreur avec “fillcolor” – Comment résoudre ceci?
Hi! This is because you are not with V12. Just delete fillcolor