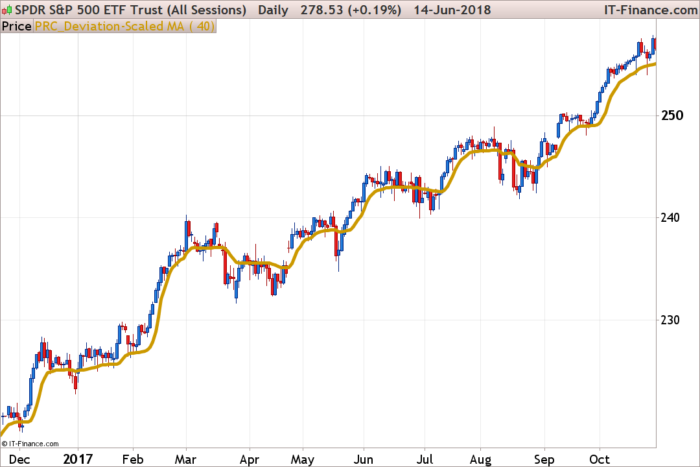
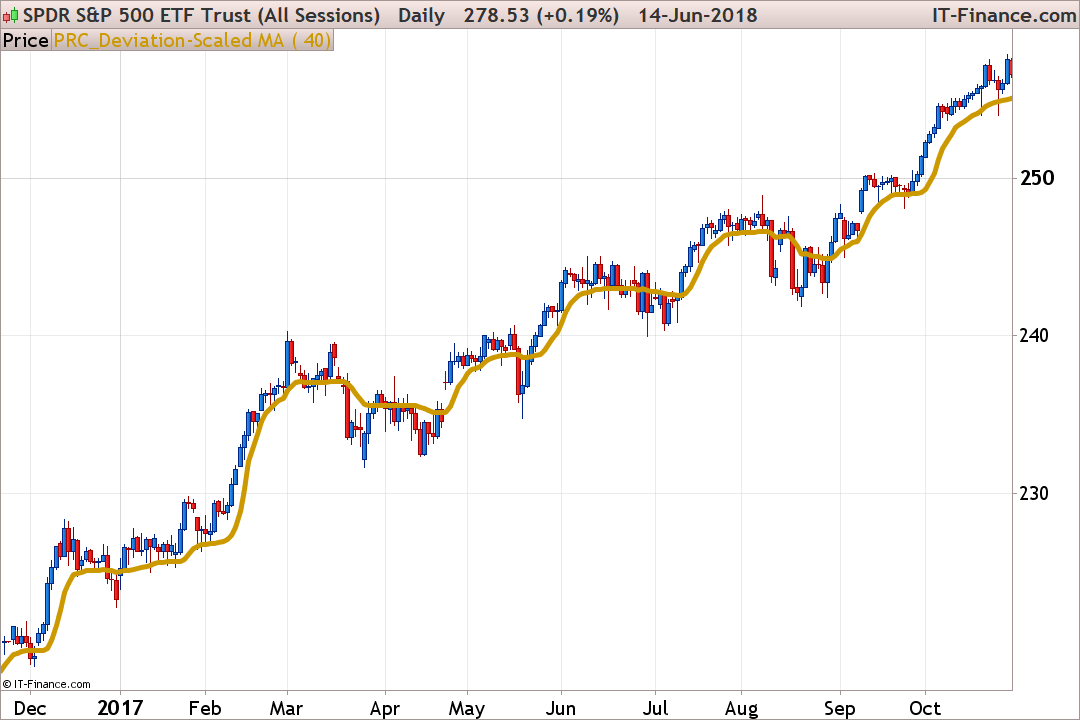
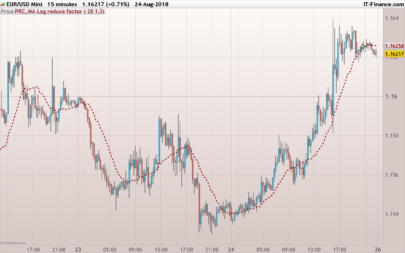
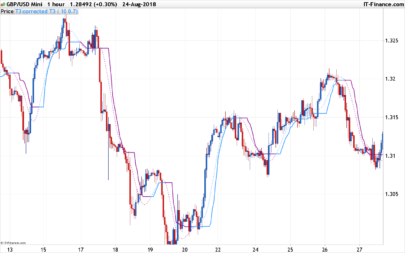
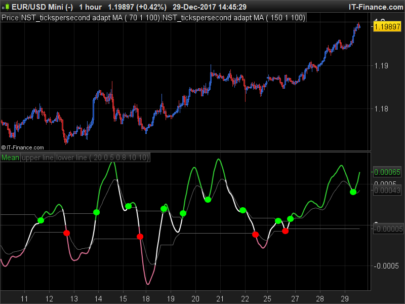
Here is the new DSMA moving average made my John Ehlers and featured in the July 2018 issue of TASC magazine.
The DSMA is an adaptive moving average that features rapid adaptation to volatility in price movement.
It accomplishes this adaptation by modifying the alpha term of an EMA byt he amplitude of an oscillator scaled in standard deviations from the mean. The DSMA’s responsiveness can be changed by using different values for the input parameter period.
John Ehlers
|
1 2 3 4 5 6 7 8 9 10 11 12 13 14 15 16 17 18 19 20 21 22 23 24 25 26 27 28 29 30 31 32 33 34 35 36 |
//PRC_Deviation Scaled Moving Average | indicator //15.06.2018 //Nicolas @ www.prorealcode.com //Sharing ProRealTime knowledge // --- settings Period = 40 // --- end of settings If barindex>Period Then //Smooth with a Super Smoother a1 = exp(-1.414*3.14159 / (.5*Period)) b1 = 2*a1*Cos(1.414*180 / (.5*Period)) c2 = b1 c3 = -a1*a1 c1 = 1 - c2 - c3 //Produce Nominal zero mean with zeros in the transfer response //at DC and Nyquist with no spectral distortion //Nominally whitens the spectrum because of 6 dB per octave //rolloff Zeros = Close - Close[2] //SuperSmoother Filter Filt = c1*(Zeros + Zeros[1]) / 2 + c2*Filt[1] + c3*Filt[2] //Compute Standard Deviation RMS = 0 For count = 0 to Period - 1 do RMS = RMS + Filt[count]*Filt[count] next RMS = SqRt(RMS / Period) //Rescale Filt in terms of Standard Deviations ScaledFilt = Filt / RMS alpha1 = Abs(ScaledFilt)*5 / Period DSMA = alpha1*Close + (1 - alpha1)*DSMA[1] endif return DSMA |
Share this
No information on this site is investment advice or a solicitation to buy or sell any financial instrument. Past performance is not indicative of future results. Trading may expose you to risk of loss greater than your deposits and is only suitable for experienced investors who have sufficient financial means to bear such risk.
ProRealTime ITF files and other attachments :
Find other exclusive trading pro-tools on ![]()
PRC is also on YouTube, subscribe to our channel for exclusive content and tutorials


@Nicolas, what would be the code if I want to use this as a Band calculated using true exponential deviation bands;
https://www.prorealcode.com/prorealtime-indicators/exponential-volatility-bands/
I have tried combining them already but my math skills fail me
You only have to replace the “EWMA” calculation from this indicator with the DSMA variable made in this one. Please let me know if you have still trouble making this.
That was actually the first thing I tried, but the result didn’t look right to me. So I started experimenting with replacing some variables of the EWMA (i.e. Dev, alpha) band with those of the DSMA (i.e. RMA, alpha1). Produces interesting results but unsure of their correctness.
Hello, Nicolas.
Nice work from you! Thank you very much. Really!
Is there a strategy that can be derived from this? e.g. buying at crosses over selling at crosses under the yellow line? Are there any results for such a strategy – possibly in combination with other strategies?
cause
I think it’s just another average more on the tableau. What can he do more than other averages? Has Ehlers tested that? Are there any results? Published?
I’m sorry, the criticism, sometimes I’m just tired of “always the same thing”.
Friendly greetings
@JohnScher, with regards to your question of can a strategy be derived from this, that is an open-ended question.
Obviously, a strategy can be derived from this as with anything else?!
And with regards to is this just another MA, yes it is. And just like any other MA it has it’s place among all the others SMA, EMA, Wilders, DEMA, ZEMA, etc.
Perhaps you can read the article in TASC, where the merits of the indicator is explained?
I personally use and experiment with all different kinds of indicators and methods to create strategies.
I love concepts such as ‘zero lag’ indicators or exponentially calculated Bollinger Bands or in this case std deviation calculated MA’s!
I am actually planning to use this to create deviation scaled exponentially calculated bollinger band.
No esta mal yo utilizo la ema 8 y la wilder8 y la banda que generan con muy buenos resultados sin embargo le he visto algun detalle interesante a esta nueva media me la estudiare con cariño y ya comentare los resultados
Hi Nicolas, do you have the MT4 version of the indicator? I am not sure if these kind of questions are welcome, if not appologies in advance. Thank you.
Hi, don’t have one sorry. But you can still ask for private coding through our programming services: https://www.prorealcode.com/trading-programming-services/
Cool. Thanks for the response.