

Directional Frequency
June 3, 2024, 1:22 PM
Indicators
1 Comment
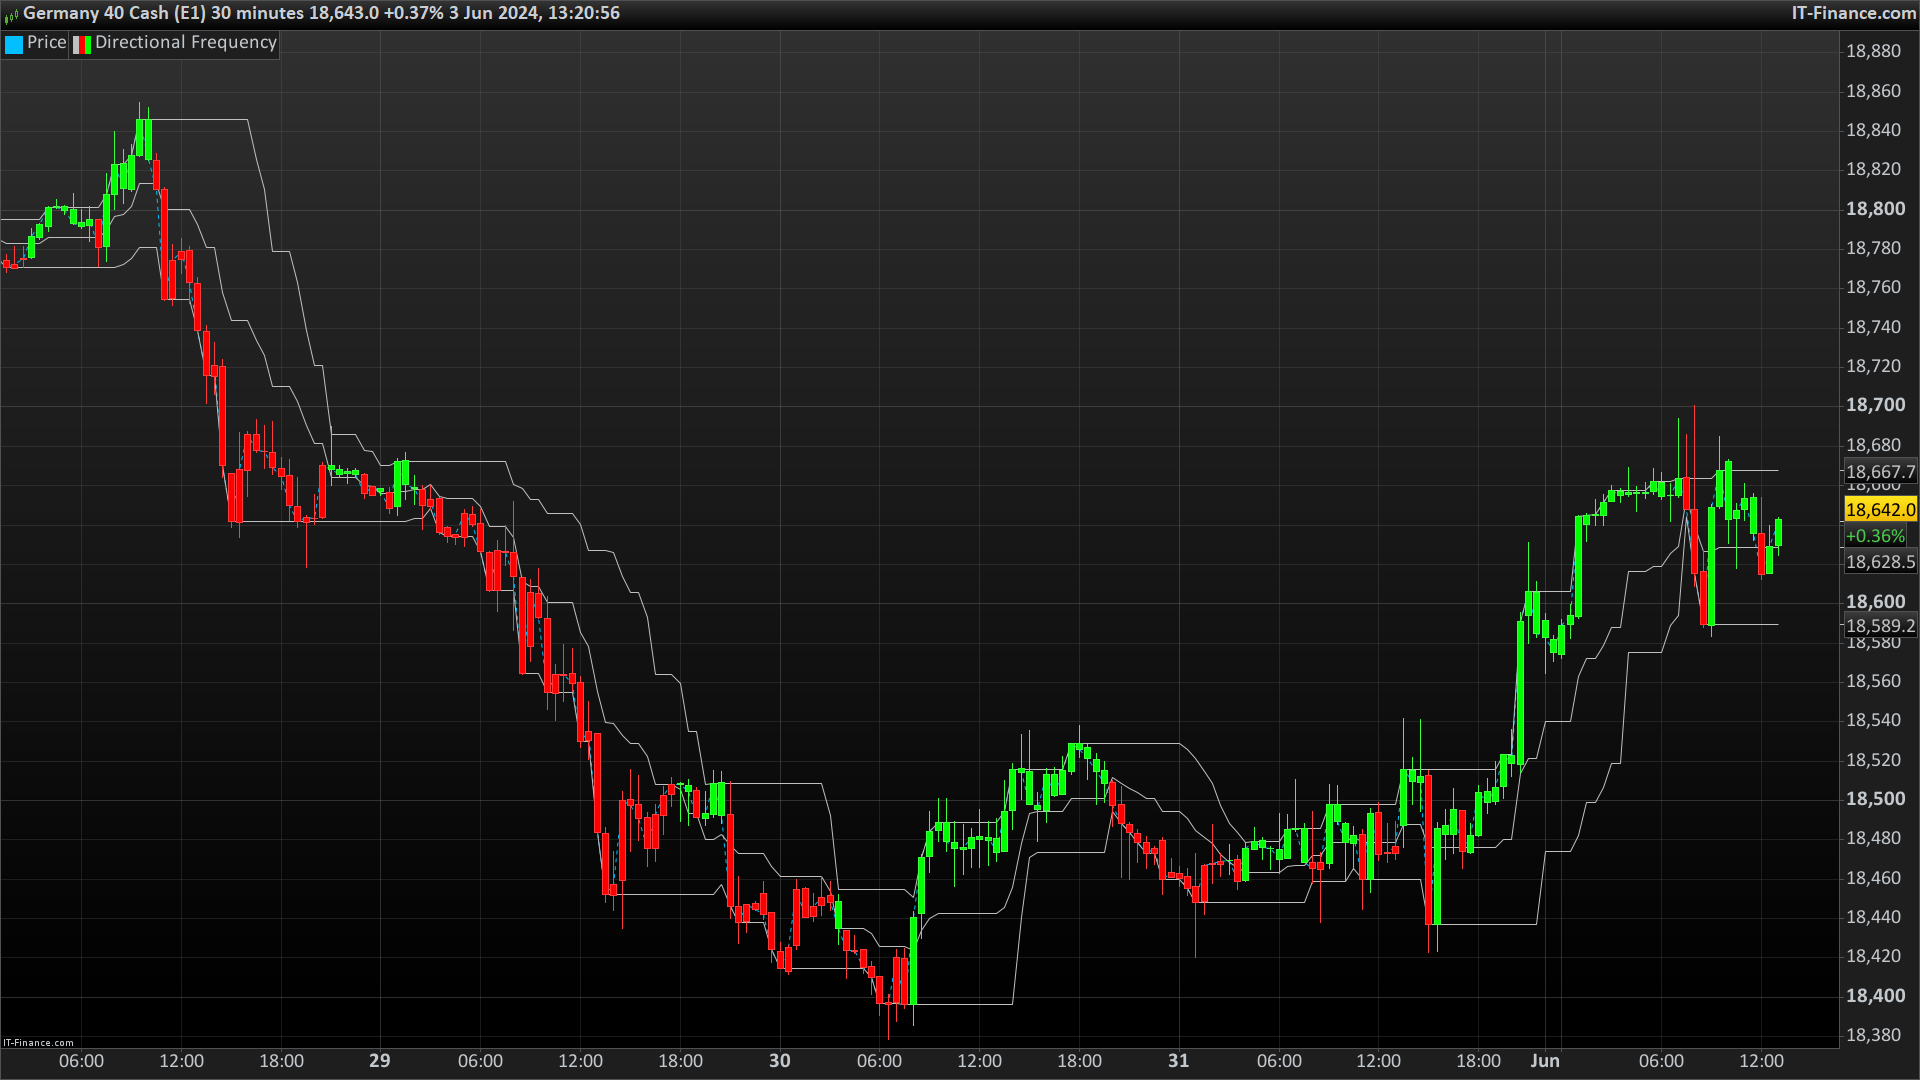
directional frequency is a very simple indicator, which visually shows when the price is in a bullish or bearish trend, comparing its position with the average of the close high and low calculated over the past period. It is possible to adjust the period parameter as desired to adapt it to your trading needs. In fact, it is set by default to 14, like the RSI, exclusively by convention.
Happy trading everyone!
period=14
///////highest close & lowest close calculation////////
hi=highest[period](close)
lo=lowest[period](close)
o=(hi+lo)/2
///////Signal///////
if close>o then
r=0
g=255
b=0
endif
if close<o then
r=255
g=0
b=0
endif
////print green and red candles if bullish or bearish///
DRAWCANDLE(open, high, low, close) coloured (r,g,b)

return hi as "hi", lo as "lo", o as "o"
Download
Filename:
Directional-Frequency.itf
Downloads:
137
Average
Currently debugging life, so my bio is on hold. Check back after the next commit for an update.
Author’s Profile
Loading...