Directional Volatility

Directional Volatility

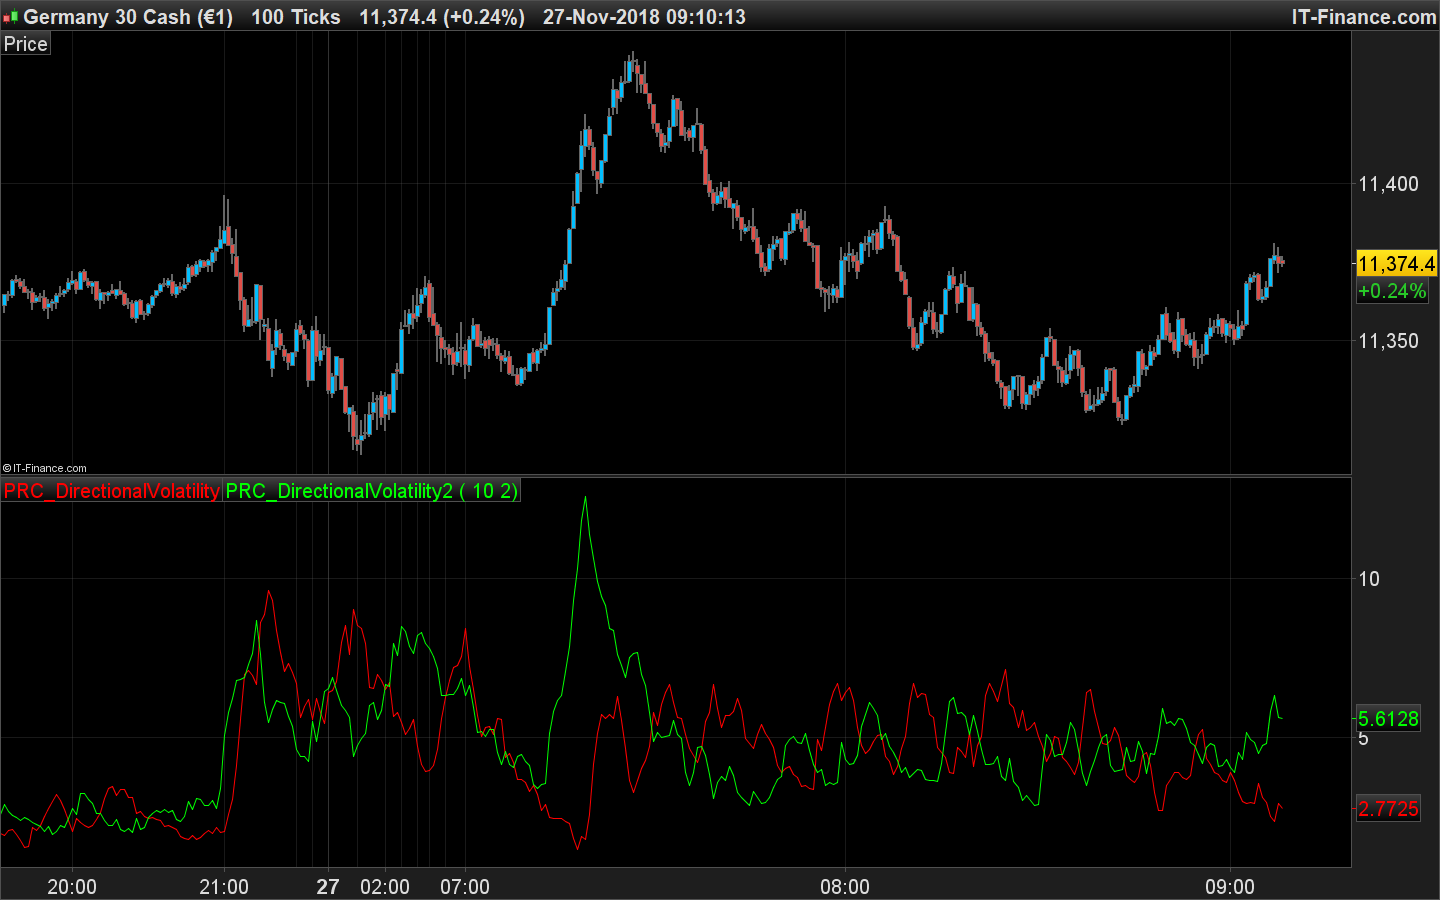
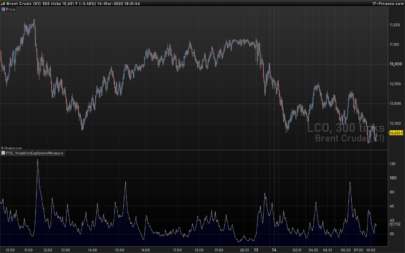
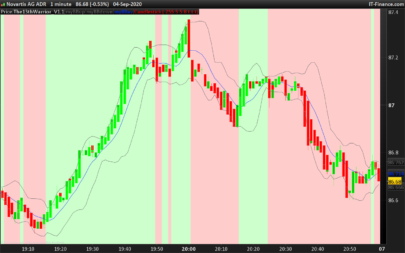
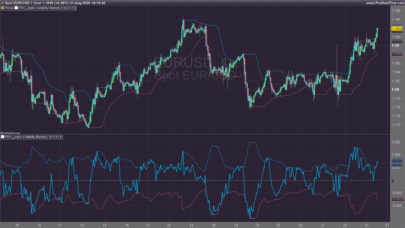
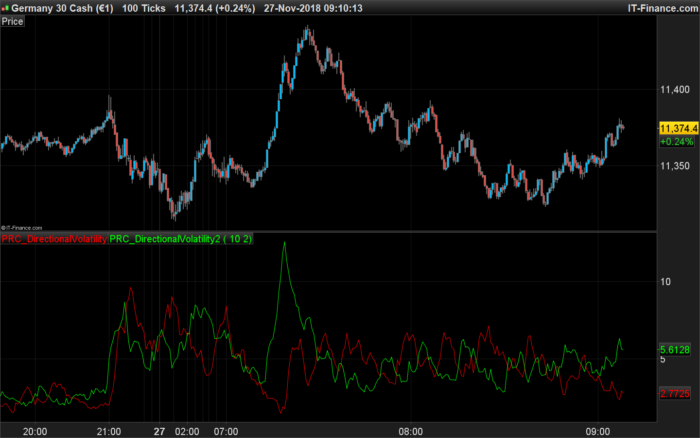
Directional Volatility indicator. The indicator displays two volatility lines – bullish and bearish ones.

It has two configurable parameters:

  • Period – calculation period
  • Deviation – deviation

It is calculated with the standard deviation from a mean of the last X Period, made of distance between the last Close with the High/Low depending of the direction (short or long curves).

Converted from a mq5 indicator by a request in the English forum.


Share this

Risk disclosure:

No information on this site is investment advice or a solicitation to buy or sell any financial instrument. Past performance is not indicative of future results. Trading may expose you to risk of loss greater than your deposits and is only suitable for experienced investors who have sufficient financial means to bear such risk.

ProRealTime ITF files and other attachments : How to import ITF files into ProRealTime platform?

PRC is also on YouTube, subscribe to our channel for exclusive content and tutorials
  1. Bard • 11/27/2018 #

    Thanks for this great addition. How would you “finish the syntax” if you were to use an ALMA moving average? Tried adding the ALMA code and Calling it. Please see code where I have used “///////////” for syntax issue. Thanks,

  2. Bard • 11/27/2018 #

    Problems with Safari latest s/ware and this site and links and adding code.
    Let me add the code here:
    https://www.dropbox.com/s/6w4266gmwlaszf9/DirectionalVolatilityALMA.rtf?dl=0

  3. grimweasel47 • 11/27/2018 #

    Ok thanks Nicolas – could this be adapted to take into account MFI and then have price, volume and vola bands around the current price bars on the chart at all?

    • Nicolas • 11/27/2018 #

      I don’t understand what you mean exactly, would be better to open a topic about this idea with a complete explanation; so I would be able to help much better.

avatar
Register or

Likes

avatar avatar avatar avatar avatar avatar avatar avatar avatar avatar avatar avatar avatar avatar avatar avatar

+6 more likes

Related users ' posts
jacquesgermain à utiliser en unité de temps jour
kats BONSOIR c bon merci j ai trouve ce weekend merci de votre reponse cdlt
the_giorgio Hi, nice work I would like to understand something about prorealtime code. With your ...
Iván Hello. When you use the drawcandle() instruction then in the configuration window you add ...
jacquesgermain sì da aggiungere
Maik2404 auf welchen Wert muss ich die Kompresionsperiode stellen?
jacquesgermain — Période de compression : ce paramètre détermine la période de rétrospection utilisée pour ...
AndPar Buongiorno Nicolas, vorrei provare questo indicatore, ma quando lo inserisco in PRT mi vengo...
Nicolas Basta aggiungerlo al prezzo https://www.prorealcode.com/blog/video-tutorials/how-to-add-an-i...
Aragorna hello Nicolas, this indicator works with the last Beta version of PRT? Ive seen tha many in...
SnorreDK Works extremely well - How? How do u implement this in a startegy? Breakoutstrategy?
Keyeming Thanks, but yes same question as above, some explanations on how to read it would be appreci...
Bateson Bonjour. Merci beaucoup ! J'ai installé l'indicateur sur PRT 11 mais pour des raisons qui ...
CederTrader Hi Denis, does this indicator add to the chart as panel, or on the candles. Thanks
Nicolas Add it on the price chart as described in this video: https://www.prorealcode.com/blog/video...
Denis Hello Nicolas and Ceder Trader, Sorry, I only just saw your replies. The indicator is alre...
Seabiscuit Hi! I like this indicator a lot, been using it on a 30 min timeframe and usually confirms my...
Ramahu Bonjour et merci pour cet indicateur ! je l'observe sur les actions du Nasdaq et la plupart ...
FernetTrader think i found a solution!
monochrome Thanks for the indicator. Very interesting!
monochrome Can you please share how you made it work? I cant seem to make it work in a strategy
Fabian Hi Thomas, thanks for your explanations. Which indicator do you use in the screenshot ...
Thomas Thats On Balance Volume and Bollinger or SMA or what you want. It shows me the volume flow. ...
bertrandpinoy @MAKSIDE I would be grateful if you send me your version. have a nice day
Nicolas Il doit s'agir d'un mauvais copier/coller. Je suggère de télécharger le fichier itf contenu ...
Bard Hello @Nicolas, I can get this to display in a separate indicator panel but not on Price as ...
Stenozar Hi @Nicolas, how can I put the bands on price? Thanks, Stefano
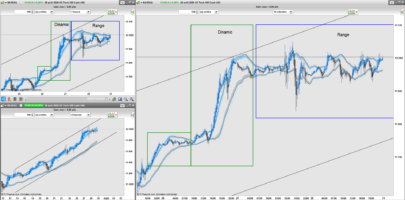
Fabian Hi IV Mcm, have you drawn the rectangles (Dinamic, Range) by yourself in the chart or are...
IV Mcm Myself to illustrate ;)
oraclus Bonjour indicateur très intéressant existe t il un screener qui détecte les actions qui donn...
IV Mcm Ce n'est pas le but de cet indicateur, mais avec un peu d'entraînement vous pourriez le code...
Yantra Thank you for sharing your good work!
Zigo
4 years ago
Zex-Indicator
Zex-Indicator
6
Indicators
bertrandpinoy Hello Zigo can you turn into an automatic strategy?
eckaw Hey @Zigo thanks for this indicator. May I ask what the multiplier 1.682 is derived from? I ...
Zigo Hello, eckaw, its not so important I had meant 1.618 and not 1.682. It has nothing to do wit...
luxrun sorry, add prt code add doesn't work
robertogozzi Don't worry about PRT code, I can't make it work either! Great for pointing that out, it's ...
Khaled @Luxrun, good morning, you mentionned "y = exponentialaverage (x)", isn't the period of the ...
luxrun One question, Roberto: the two AvgT are variable, could you explain to me what they regulate...
robertogozzi AvgT stands for Average Type, it's a parameter for the AVERAGE keyword (https://www.prorealc...
robertogozzi Yes, you can use any setting that suits you best! As to which one... it depends on the inst...
DaxRider grazie Robnerto
Nicolas remplacer les valeurs de coloured(0,255,0) par coloured(r,g,b) et ajouter ces noms de variab...
mohamed merci Nicolas!
sacram14 Merci Nicolas pour ce set-up que je ne connaissais pas ! J'ai tenté de reprendre le code pou...

Top