







Draw Forex institutional levels
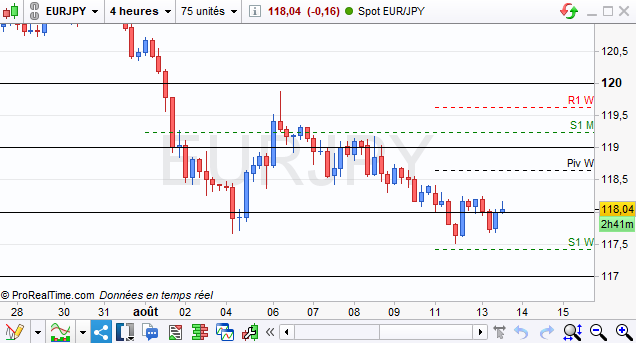
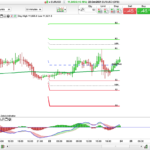
If like me you are trading institutional levels on Forex and want them to always appear automatically around the price, here is a little indicator to do that, easily customizable.
Valid for all pairs and JPY pairs.
It draws a maximum of 4 lines around the price.
// Draw Forex Institutionnal levels
// Etops 13/08/2019
defparam drawonlastbaronly=true

price = close[0]
if price/10 <1 then
 ref = round(close[0]*100)/100
 step = 0.01

 drawhline(ref) coloured(0,0,0)
 if abs(price-(ref+step))<0.0200 then
  drawhline(ref+step) coloured(0,0,0)
 endif
 if abs(price-(ref+2*step))<0.0200 then
  drawhline(ref+2*step) coloured(0,0,0)
 endif
 if abs(price-(ref-step))<0.0200 then
  drawhline(ref-step) coloured(0,0,0)
 endif
 if abs(price-(ref-2*step))<0.0200 then
  drawhline(ref-2*step) coloured(0,0,0)
 endif
else
 //for JPY pairs
 ref = round(close[0])
 step = 1

 drawhline(ref) coloured(0,0,0)
 if abs(price-(ref+step))<2 then
  drawhline(ref+step) coloured(0,0,0)
 endif
 if abs(price-(ref+2*step))<2 then
  drawhline(ref+2*step) coloured(0,0,0)
 endif
 if abs(price-(ref-step))<2 then
  drawhline(ref-step) coloured(0,0,0)
 endif
 if abs(price-(ref-2*step))<2 then
  drawhline(ref-2*step) coloured(0,0,0)
 endif
endif

return
Comments
You must be logged in to post a comment.

Hello, les niveaux sur lesquels il y a des réactions fortes de la part des banques, les niveaux ronds pour moi vu que je fais du swing H4. Ex EUR/USD : 1.11 , 1.12, 1.09 ... En intraday sur le forex, les niveaux sont x.20 , x.50, x.80. Ex EUR/USD : 1.1120 , 1.1150, 1.1280 ... J'aurais donc du préciser que mon indicateur est adapté à mon swing D/H4, pas à de l'intraday.
Hi have been trying to modify the code you so kindly shared to reflect to the image you have attached. I am not sure how the lines should be labelled, however I have tried to modify the code. Just so you know I am not a real coder. Here is what I have done so far. // Draw Forex Institutionnal levels // Etops 13/08/2019 defparam drawonlastbaronly=true price = close[0] if price/10 <1 then ref = round(close[0]*100)/100 step = 0.01 S1M= ref + step R1W= ref+2*step Piv = ref S1W = ref-2*step Startfrom = 0 Offset = 8 * pipsize drawhline(ref) coloured(0,0,0) Style(dottedline,1) DRAWTEXT("Piv W", barindex + 25, Piv + offset, Dialog,italic,10) coloured(0,0,0) if abs(price-(ref+step))<0.0200 then drawhline(ref+step) coloured(0,255,0) style(dottedline,1) DRAWTEXT("S1 M", barindex + 5, S1M + offset, Dialog,italic,10) coloured(0,255,0) endif if abs(price-(ref+2*step))<0.0200 then drawhline(ref+2*step) coloured(255,0,0) style(dottedline,1) DRAWTEXT("R1 W", barindex+ 5, R1W+ offset, Dialog,italic,10) coloured(255,0,0) endif if abs(price-(ref-step))<0.0200 then drawhline(ref-step) coloured(0,0,0) style(dottedline,1) DRAWTEXT("Piv W", barindex+ 5, Piv + offset, Dialog,italic,10) coloured(0,255,255) endif if abs(price-(ref-2*step))<0.0200 then drawhline(ref-2*step) coloured(0,255,0) style(dottedline,1) DRAWTEXT("S1 W", barindex+ 5, S1W + offset, Dialog,italic,10) coloured(0,255,0) endif else What I would like to understand is what is the difference from the first Drahline(ref), and the drawline(ref-step), and what should be the corresponding labels and what they signify/reference, e.g. "R1 W", "S1 M" vs "S1 W". many tahnks
Hi, I have been looking for something like this. I have a f questions about the indicator. Does it work on all time frames, for example will I see lines at different levels when I look at the 1HR and Daily? Or are the labels you have shown in the image referring to time frames, e.g. Monthly, Weekly, Daily, 4HR? Also, how do you add the labels to your code. I am not very good at coding, can make a few adjustments but that is about it. Thank you in Advance.