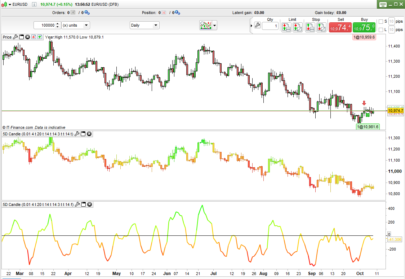
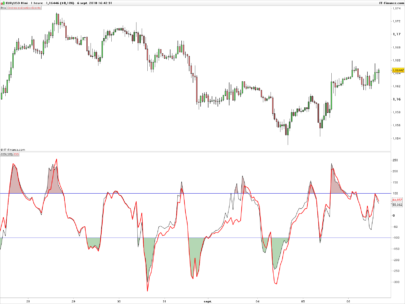
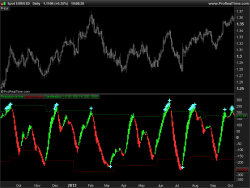
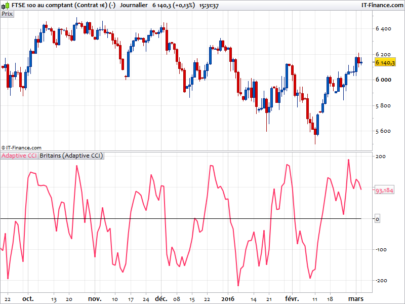
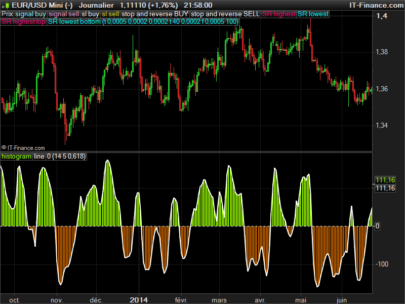
This oscillator is made of a derivated CCI indicator and its standard deviation. The concept behind this indicator is to draw the derivated price over a bounded oscillator.
The 2 standard deviation of the oscillator are dynamic to reflect the near-past high and low deviations.
|
1 2 3 4 5 6 7 8 9 10 11 |
ma=average[length](close-close[1]) ret=((close-close[1]) - ma) / (0.015 * std[length](close-close[1])) c = exponentialaverage[smooth](exponentialaverage[smooth](ret)) pos = std[length](c) neg = -std[length](c) hh=highest[length](max(pos,neg)) ll=lowest[length](min(pos,neg)) RETURN hh coloured(0,255,0) as "ob", ll coloured(255,0,0) as "os", c coloured(255,255,0) as "cci" |
Share this
No information on this site is investment advice or a solicitation to buy or sell any financial instrument. Past performance is not indicative of future results. Trading may expose you to risk of loss greater than your deposits and is only suitable for experienced investors who have sufficient financial means to bear such risk.
ProRealTime ITF files and other attachments :PRC is also on YouTube, subscribe to our channel for exclusive content and tutorials


Awesome. Can we have a stock screener for this one too please?
Why not, but a stock screener for what conditions?
Whenever the yellow CCI line goes “outside” the bands. Which will alert us of possible reversal scalp trade. What do you think?
ok why not, please add a request in the appropriate forum section, many thanks.