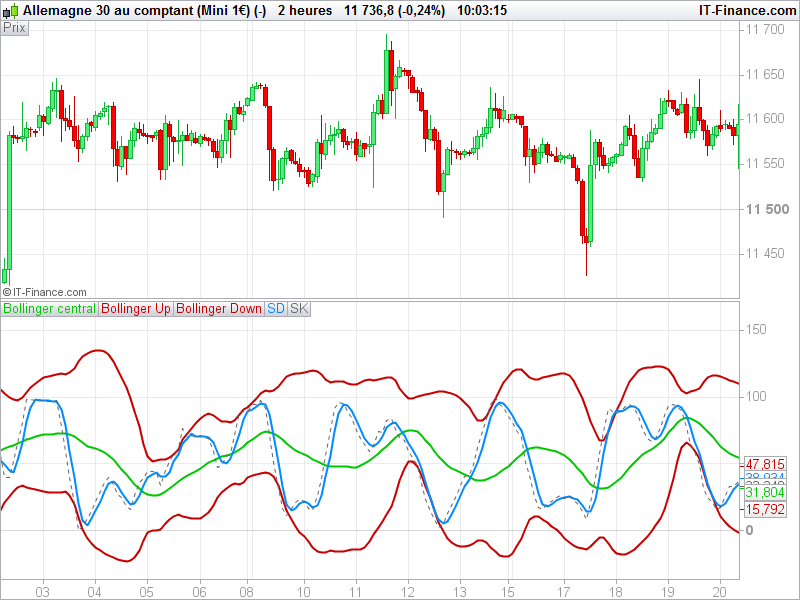
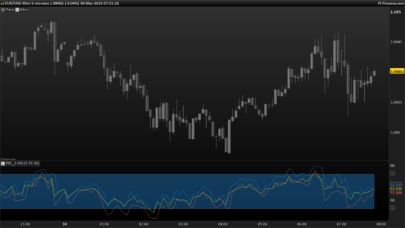
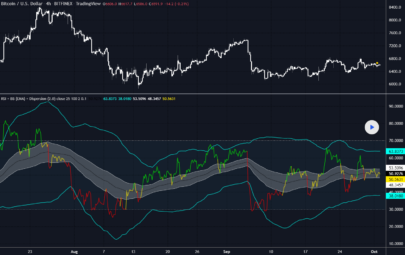
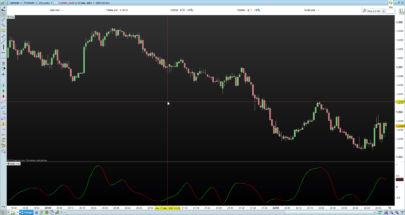
This indicator make stochastic calculation of a RSI indicator over the last X periods (RSI and stochastic periods can be modified in the first line of code).
By adding Bollinger bands of 2 standard deviations of the “Stoch RSI” curve, dynamic zones of overbought and oversold areas are displayed.
This code has been translated from LUA programming language, original indicator from fxcodebase.
|
1 2 3 4 5 6 7 8 9 10 11 12 13 14 15 16 17 18 19 20 21 22 23 24 25 26 27 28 29 30 31 32 33 34 35 |
//PRC_Dynamic Zone StochRSI | indicator //17.02.2017 //Nicolas @ www.prorealcode.com //Sharing ProRealTime knowledge //converted from LUA (TS2) version // --- parameters N=14 //Number of periods for RSI K=14 //%K Stochastic Periods KS=5 //%K Slowing Periods D=3 //%D Slowing Stochastic Periods //Bollinger Band Calculation Period=20 Dev=2.0 //Number of standard deviations // --- end of parameters rrsi = rsi[N] maxrsi = highest[K-1](rrsi) minrsi = lowest[K-1](rrsi) if maxrsi=minrsi then ski = 100 else ski = (rrsi-minrsi)/(maxrsi-minrsi)*100 endif SK = average[KS](ski) SD = average[D](SK) BB = average[Period](SK) BBup = BB+std[Period](sk)*dev BBdn = BB-std[Period](sk)*dev RETURN BB coloured(0,200,0) style(line,2) as "Bollinger central", BBup coloured(200,0,0) style(line,2) as "Bollinger Up", BBdn coloured(200,0,0) style(line,2) as "Bollinger Down", SD coloured(0,140,255) style(line,2) as "SD", SK coloured(100,100,100) style(dottedline,1) as "SK" |
Share this
No information on this site is investment advice or a solicitation to buy or sell any financial instrument. Past performance is not indicative of future results. Trading may expose you to risk of loss greater than your deposits and is only suitable for experienced investors who have sufficient financial means to bear such risk.
ProRealTime ITF files and other attachments :PRC is also on YouTube, subscribe to our channel for exclusive content and tutorials






bonjour a tous
quelqu un pourait il recodé en prt il sagit du dynamique zone ma, je n arrive pas a joindre le gif qui correspond mais code tres intéréssant.
merci pour la communauté prt.
voici le code:
#property indicator_chart_window#property indicator_buffers 6#property indicator_color1 DeepSkyBlue#property indicator_color2 LimeGreen#property indicator_color3 LimeGreen#property indicator_color4 Red#property indicator_color5 Red#property indicator_color6 Peru#property indicator_style3 STYLE_DOT#property indicator_style4 STYLE_DOT#property indicator_style6 STYLE_DASH#property indicator_width1 3#property indicator_width2 2#property indicator_width5 2
//////////
#import “dynamicZone.dll” double dzBuyP(double& sourceArray[],double probabiltyValue, int lookBack, int bars, int i, double precision); double dzSellP(double& sourceArray[],double probabiltyValue, int lookBack, int bars, int i, double precision);#import
////// ////
extern int Length = 21;extern int Price = 0;extern bool ShowMiddleLine = true;extern int DzLookBackBars = 35;extern double DzStartBuyProbability1 = 0.10;extern double DzStartBuyProbability2 = 0.25;extern double DzStartSellProbability1 = 0.10;extern double DzStartSellProbability2 = 0.25;
//////////
double MABuffer[];double alpha[];double prices[];double bl1Buffer[];double bl2Buffer[];double sl1Buffer[];double sl2Buffer[];double zliBuffer[];double stored[][7];
//+——————————————————————+//| |//+——————————————————————+//////////
int init(){ SetIndexBuffer(0,MABuffer); SetIndexBuffer(1,bl1Buffer); SetIndexBuffer(2,bl2Buffer); SetIndexBuffer(3,sl2Buffer); SetIndexBuffer(4,sl1Buffer); SetIndexBuffer(5,zliBuffer); IndicatorShortName(“Jurik filter simple (“+Length+”)”); return(0);}int deinit() { return(0); }
//+——————————————————————+//| |//+——————————————————————+//////////
int start(){ double precision = Point*100.0; int counted_bars=IndicatorCounted(); int i,r,limit;
if(counted_bars<0) return(-1); if(counted_bars>0) counted_bars–; limit = Bars-counted_bars; if (ArrayRange(prices,0) != Bars) ArrayResize(prices,Bars);
// // // // // for (i=limit, r=Bars-i-1; i>=0; i–,r++) { prices[r] = iMA(NULL,0,1,0,MODE_SMA,Price,i); MABuffer[i] = iNoLagMa(alpha,prices,1,Length,i,r); if (DzStartBuyProbability1 >0) bl1Buffer[i] = dzBuyP (MABuffer, DzStartBuyProbability1, DzLookBackBars, Bars, i, precision); if (DzStartBuyProbability2 >0) bl2Buffer[i] = dzBuyP (MABuffer, DzStartBuyProbability2, DzLookBackBars, Bars, i, precision); if (DzStartSellProbability1>0) sl1Buffer[i] = dzSellP(MABuffer, DzStartSellProbability1, DzLookBackBars, Bars, i, precision); if (DzStartSellProbability2>0) sl2Buffer[i] = dzSellP(MABuffer, DzStartSellProbability2, DzLookBackBars, Bars, i, precision); if (ShowMiddleLine) zliBuffer[i] = dzSellP(MABuffer, 0.5 , DzLookBackBars, Bars, i, precision); } return(0);}
//+——————————————————————+//| |//+——————————————————————+//////////
#define Pi 3.1415926535
//////////
double values[][3];#define _length 0#define _len 1#define _weight 2
//////////
double iNoLagMa(double &alpha[], double &price[], int forvalue, int length, int i, int r){ int forValue = forvalue-1; if (length<3) return(price[r]); // // // // // if (ArrayRange(values,0)<(forValue+1) || values[forValue][_length] != length) { double Cycle = 4.0; double Coeff = 3.0*Pi; int Phase = length-1; if (ArrayRange(values,0)<forValue+1) ArrayResize(values,forValue+1);
values[forValue][_length] = length; values[forValue][_len] = length*4 + Phase; values[forValue][_weight] = 0; ArrayResize(alpha,values[forValue][_len]);
for (int k=0; k<values[forValue][_len]-1; k++) { if (k<=Phase-1) double t = 1.0 * k/(Phase-1); else t = 1.0 + (k-Phase+1)*(2.0*Cycle-1.0)/(Cycle*length-1.0); double beta = MathCos(Pi*t); double g = 1.0/(Coeff*t+1); if (t <= 0.5 ) g = 1; alpha[k] = g * beta; values[forValue][_weight] += alpha[k]; } } // // // // // if (values[forValue][_weight]>0) { int len = values[forValue][_len]; double sum = 0; for (k=0; k < len-1; k++) sum += alpha[k]*price[r-k]; return( sum / values[forValue][_weight]); } else return(0); }
Merci de faire une requête spécifique sur le forum.