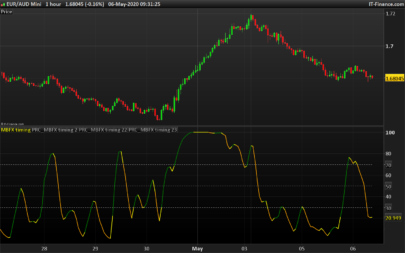
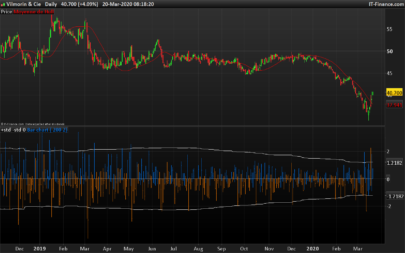
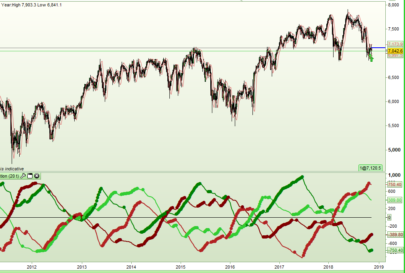
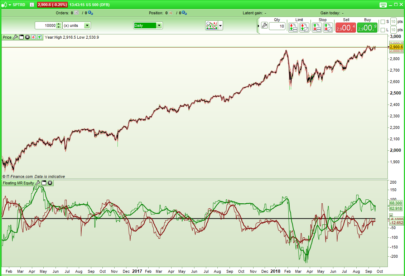
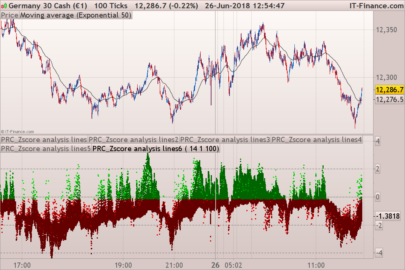
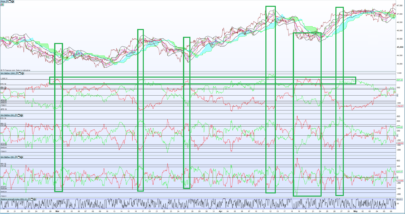
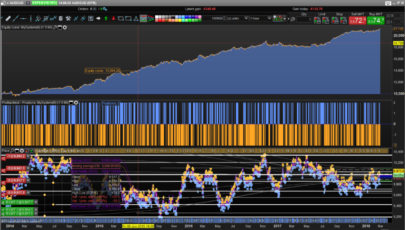
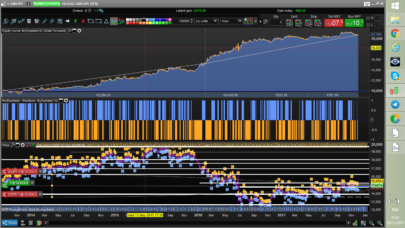
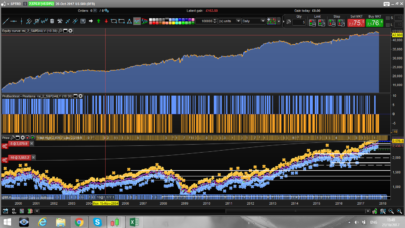
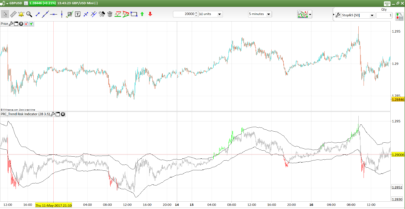
Another good representation of price derivating from its mean. Simple and effective one though, it can be easily use for scalping purpose on minimal timeframe or ticks charts.
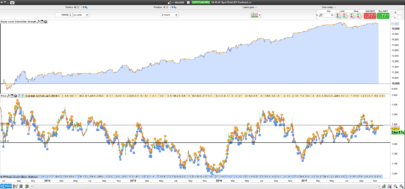
When price reach the “2” line, it’s time to operate a short trade and a long trade when oscillator piercing the 0 value treshold (see screenshot).
Of course any signals are not quite good and minimal objectives should be focus when using this kind of trading strategy.
Here is the code :
|
1 2 3 4 5 6 7 8 9 10 11 12 |
// Period = 10 (as parameter) i1=STD[Period](close) i2=Average[Period](close)+(i1*2) i4=i2-Close i=(i4/i1)/2 line1 = 0 line2 = 2 mean = 1 RETURN i coloured(255,255,0) AS "Elasticity", line1 coloured(173,255,47) AS "buy action", line2 coloured(255,64,64) AS "sell action", mean coloured(255,239,213) AS "mean price" |
Share this
No information on this site is investment advice or a solicitation to buy or sell any financial instrument. Past performance is not indicative of future results. Trading may expose you to risk of loss greater than your deposits and is only suitable for experienced investors who have sufficient financial means to bear such risk.
ProRealTime ITF files and other attachments :PRC is also on YouTube, subscribe to our channel for exclusive content and tutorials


