El’s Better Volume

El’s Better Volume

Hi all

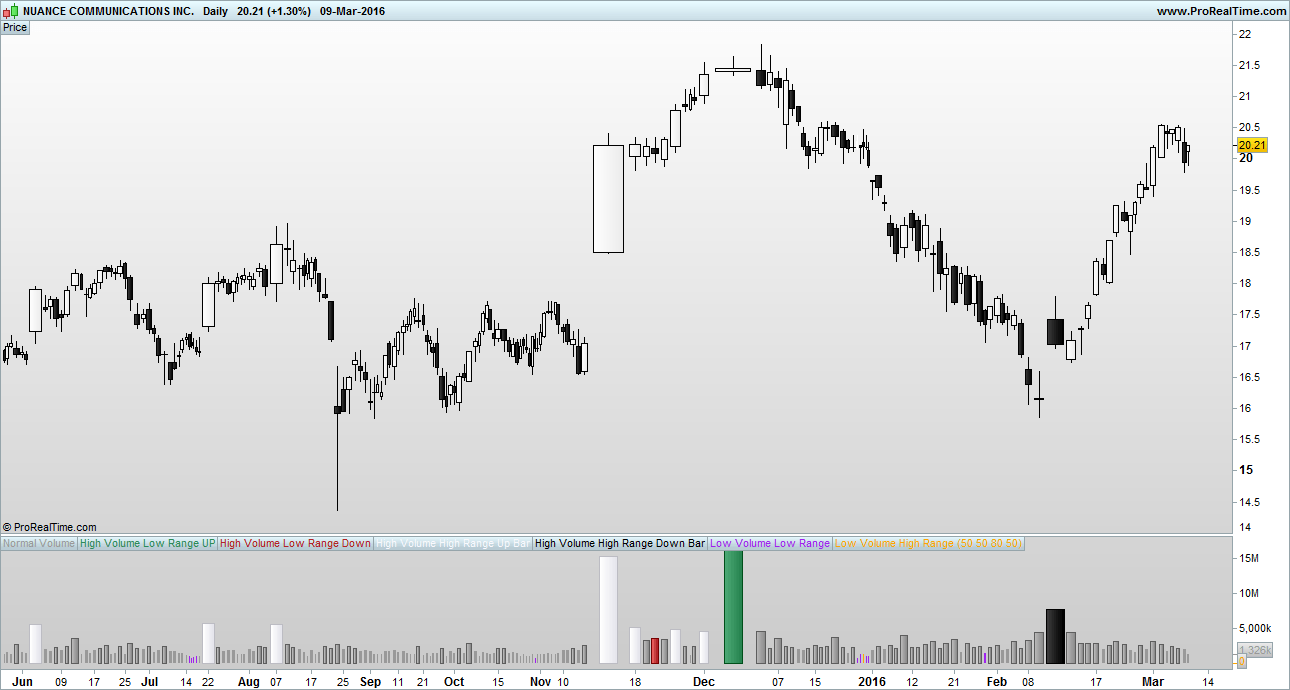
Thought id share my Better Volume indicator to contribute something to the site 🙂 this is my solution to a problem as i felt other better volume indicators out there were over complicating the problem. I used a few MA’s and the built in RANGE() to clean it up.

A link about ‘Better Volume’ and how to interpret it…
http://emini-watch.com/free-stuff/volume-indicator/

You may need to change the colours around for better visability on your background. Feel free to mod it asyou like.

El

Share this

Risk disclosure:

No information on this site is investment advice or a solicitation to buy or sell any financial instrument. Past performance is not indicative of future results. Trading may expose you to risk of loss greater than your deposits and is only suitable for experienced investors who have sufficient financial means to bear such risk.

ProRealTime ITF files and other attachments : How to import ITF files into ProRealTime platform?

PRC is also on YouTube, subscribe to our channel for exclusive content and tutorials

  1. Tarquin • 03/10/2016 #

    Hi,
    Thanks for posting this, I downloaded your first version of Better Volume and it works really well. So I tried loading your second version when I saw the link and although the file is described as my-better-volume-2.itf it only downloads as my-better-volume-1.itf. Am I doing something wrong, or is it possible the link on your post contains the previous file and not the new one?
    Kind Regards,
    Tony

  2. El Chupacabra • 03/10/2016 #

    Hi Tony, just seen your message. TBH I haven’t made a version 2!, maybe the moderator has done? Its a bit of a funny system on here you cant just add your own indicators and stuff without it going through a moderator first. Here is the code im using mate, keep it simple :)….
    // Variables to add:
    // Label in Program = \"vMA\", Label in properties window = \"Volume Moving Average\", Type = int, Default = \"50\"
    // Label in Program = \"vPercentLower\", Label in properties window = \"Low Volume %\", Type = int, Default = \"50\"
    // Label in Program = \"vPercentHigerr\", Label in properties window = \"High Volume %\", Type = int, Default = \"80\"
    // Label in Program = \"BarRanger\", Label in properties window = \"Bar Range\", Type = int, Default = \"50\"

    //Change all indicator styles to \"Histogram\" apart from teh two volume moving averages : LowVolume, HighVolume ..... keep them as lines or make them invisable

    VolumeMA = Average[vMA](VOLUME)

    LowVolume = (VolumeMA - ((VolumeMA * vPercentLower) / 100))
    HighVolume = (VolumeMA + ((VolumeMA * vPercentHigher) / 100))

    Vol = VOLUME
    ONCE HVLRU = 0
    ONCE HVLRD = 0
    ONCE HVHRU = 0
    ONCE HVHRD = 0
    ONCE LVLR = 0
    ONCE LVHR = 0

    c1 = VOLUME > HighVolume AND RANGE < Average[BarRange](RANGE) AND CLOSE > OPEN
    IF c1 THEN
    HVLRU = VOLUME
    Vol = 0
    ELSE
    HVLRU = 0
    ENDIF

    c2 = VOLUME > HighVolume AND RANGE < Average[BarRange](RANGE) AND CLOSE < OPEN
    IF c2 THEN
    HVLRD = VOLUME
    Vol = 0
    ELSE
    HVLRD = 0
    ENDIF

    c3 = VOLUME > HighVolume AND RANGE > Average[BarRange](RANGE) AND CLOSE > OPEN
    IF c3 THEN
    HVHRU = VOLUME
    Vol = 0
    ELSE
    HVHRU = 0
    ENDIF

    c4 = VOLUME > HighVolume AND RANGE > Average[BarRange](RANGE) AND CLOSE < OPEN
    IF c4 THEN
    HVHRD = VOLUME
    Vol = 0
    ELSE
    HVHRD = 0
    ENDIF

    c5 = VOLUME < LowVolume AND RANGE < Average[BarRange](RANGE)
    IF c5 THEN
    LVLR = VOLUME
    Vol = 0
    ELSE
    LVLR = 0
    ENDIF

    c6 = VOLUME < LowVolume AND RANGE > Average[BarRange](RANGE)
    IF c6 THEN
    LVHR = VOLUME
    Vol = 0
    ELSE
    LVHR = 0
    ENDIF

    RETURN Vol COLOURED (153,153,153) AS \"Normal Volume\", HVLRU COLOURED (46,139,87) AS \"High Volume Low Range UP\", HVLRD COLOURED (178,34,34) AS \"High Volume Low Range Down\", HVHRU COLOURED (248,248,255) AS \"High Volume High Range Up Bar\", HVHRD COLOURED (0,0,0) AS \"High Volume High Range Down Bar\", LVLR COLOURED (160,32,240) AS \"Low Volume Low Range\", LVHR COLOURED (255,165,0) AS \"Low Volume High Range\", HighVolume COLOURED (216,191,216) AS \"High Vol MA\", LowVolume COLOURED (216,191,216) AS \"Low Vol MA\"


avatar
Register or

Likes

avatar avatar avatar avatar avatar
Related users ' posts
Iván Hi! just change line13 for this: showsignals=1
Quino Hi Excellent indicator as usual. Just 2 questions: Why LenH and LenL = 15 as Len could be...
Iván Hi! good question. This is a code request traslation from other platform. I took same inputs...
roccafragius Thank you Ivan, very Useful! I would like translation of Trading View CCI_S Indicator, How ...
Iván hi, you can ask here: https://www.prorealcode.com/free-code-conversion/
Iván È possibile che siano state caricate troppe barre nel grafico.
NicoGB67 Hola Iván, en primer lugar agradecerte el trabajo que haces, y comentarte algo sobre este in...
okeus ok fatto avevi ragione, grazie
Ciccarelli Franco Scusa e cosa devo cambiare? Grazie
Sofitech Bonjour Ivan, comment pourrais tu modifier ce code pour qu'un histogramme indiquant la créat...
geroniman Merci Ivan, cet indicateur est excellent. Comme les cours s'arretent souvent sur les 50% d'u...
sanchota Mira que has hecho unos cuantos indicadores,pues este los supera a todos.Brillante.
Gaspare Grazie Ivan, ottimo indicatore posso chiedere, per favore, una strategia che apre posizio...
Iván thanks! maybe I could test it
foufurieux
1 month ago
ANTS indicator
ANTS indicator
3
Indicators
atlante good morning the indicatordoes not display the photo you postes only upload nessages appear ...
foufurieux Please find a new image of the indicator
foufurieux Sorry impossible adding a new image
NicoGB67 me sigue dando error en algunas líneas: 8, 44, 45, 46, 47 y 49, no sé si será por la traducc...
jacquesgermain voir le forum proscreener topic "screener momentum bias" je vous ai déposé le fichier momen...
jacquesgermain
2 months ago
jacquesgermain à utiliser en unité de temps jour
patapouf Pourrait-on créer un screener sur la base de cet indicateur, dont l'idée semble très pertine...
jacquesgermain le voici (détecte le croisement bande haute ou bande basse) : timeframe(monthly) c1=open ...
okeus Ivan, riesci a creare un indicatore per le "evolventi paraboliche" ? grazie
groelandes Impagable tu trabajo cada semana. ¡Gracias!
Iván de nada! :)
Row trading Hi, to see the current day put : for y = i-1 to i-1 do to see all days put : for y = 1 t...
Razz Hi, thanks for your answer. I'll keep an eye on the whole thing, I've now expanded it to in...
Razz Adding an image did not work : https://www.directupload.eu/file/d/8765/3ez6bzlq_png.htm
groelandes Me uno al comentario de Edelmiro. Un millón de gracias por el trabajo constante, dándonos in...
JohnScher Ja, das würde mich auch interessieren
MARTINALA CARTINA ciao,complimenti .SIispira ai canali di migliorino per caso?grazie

Top