This indicator finds trend following engulfings, and draws order blocks based on the 1st candle’s range (the first candle of the engulfing pattern). It does filter the trend with simple moving averages of 21 and 55 periods, but it doesn’t filter for retracements in the trend (you should consider only the order blocks that are coming from engulfings after a retracement) .
Converted as requested here https://www.prorealcode.com/topic/ema-speed-acceleartion-para-prt/.
|
1 2 3 4 5 6 7 8 9 10 11 12 13 14 15 16 17 18 19 20 21 22 23 24 25 26 27 |
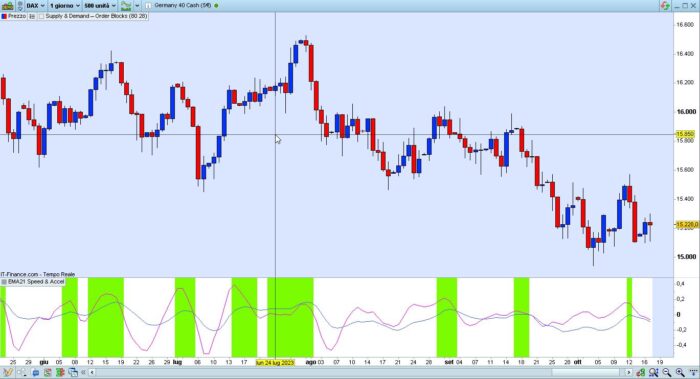
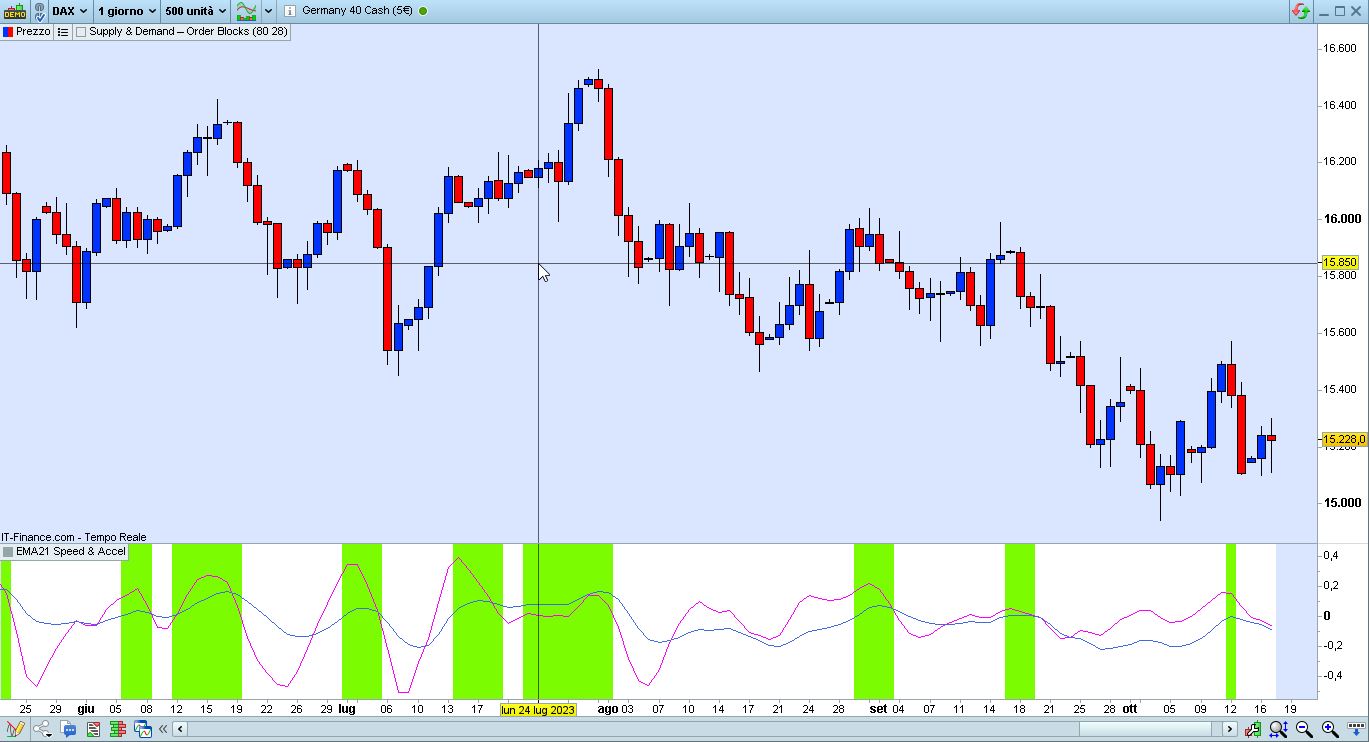
//EMA21 Speed & Accel // // //https://www.prorealcode.com/topic/ema-speed-acceleartion-para-prt/ // //@version=4 by Saltapones // backgroundcolor("White") NP = 1 len1 = 21 //out1 = average[len1,1](close) SMAS = (1.50*average[len1,1](close)-2*average[len1,1](close[NP])+0.5*average[len1,1](close[2*NP]))/(NP*average[len1,1](close)) SMASMA = average[5,0](SMAS) y = max(SMASMA*100,-5) CURV = (average[len1,1](close)-2*average[len1,1](close[NP])+average[len1,1](close[2*NP]))/(NP*NP) CURVMA = average[5,0](CURV) maxslope = highest[200](SMASMA)*100 maxcurvature = highest[200](CURVMA) scale = 1*maxslope/maxcurvature x = min(CURVMA*scale,5) IF CURV <= 0 THEN x = max(CURVMA*scale,-5) ENDIF IF CURVMA >= 0 AND SMASMA >= 0 THEN backgroundcolor("LawnGreen") ENDIF RETURN x AS "Curvature" coloured(255,0,255,255),y AS "Average" coloured(65,105,225,255) |
Share this
No information on this site is investment advice or a solicitation to buy or sell any financial instrument. Past performance is not indicative of future results. Trading may expose you to risk of loss greater than your deposits and is only suitable for experienced investors who have sufficient financial means to bear such risk.
ProRealTime ITF files and other attachments :PRC is also on YouTube, subscribe to our channel for exclusive content and tutorials


thanks a lot. description of the indicator seems wrong …
Sorry, you’re right.
The correct description, from https://www.tradingview.com/script/omlpqq5X/, is:
.
“The script calculates an plots first and second derivatives of a EMA of “length” periods, with a default
value of 21 periods.
– Blue curve is the first derivative of the EMA, which can be interpreted as the “speed” , “slope”, or
percentage of gains (or loses) walking over the EMA, measured in % per period. If timeframe is Days,
it will show a %/day on the scale @ the right of graphic.
– Fuchsia curve is the second derivative of the EMA, and can be assumed to be the “acceleration” or
driving force that could augment or diminish the EMA Speed.
When Speed & Acceleration ar both >=0, EMA is in positive rally, and becoming stepper, so the bacground
is colored green.
First and second derivatoves are performed using “basis functions”, as are applied in FEM implementation.”