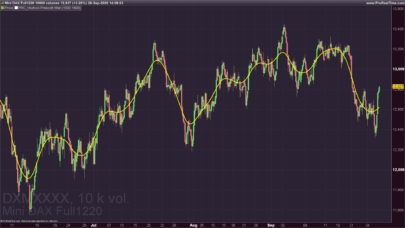
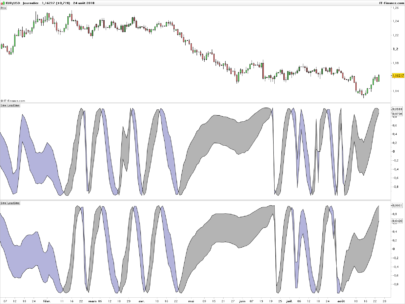
The even better sinewave is another indicator of signal noises filtering made by John F. Ehlers. It introducts cycles passthru as low pass filter of prices. This indicator is described in the John Ehlers’book “Cycle Analytics for Traders”.
As any other bounded oscillator, this one also include “overbought” and “oversold” territories of 0.85 and -0.85 default levels.
As a matter of fact this indicator can nicely show bullish and bearish cycle momentum of price but also with some lagging effect, included by its filtering capability. It should not be use alone but as it is intended to do, like a filter.
|
1 2 3 4 5 6 7 8 9 10 11 12 13 14 15 16 17 18 19 20 21 22 23 24 25 26 27 28 29 |
//parameters // Duration = 36 // lowerBand = 9 if(barindex>10) then OB = 0.85 OS = -0.85 Pi = 3.14159265358979 angle = ((360*Pi)/180)/Duration alpha1 = (1-sin(angle))/cos(angle) HP = 0.5*(1+alpha1)*(close-close[1])+alpha1*HP[1] ang = sqrt(2)*Pi/lowerBand a1 = exp(-ang) b1 = 2*a1*cos(ang) c2 = b1 c3 = -a1*a1 c1 = 1 - c2 - c3 filt = c1*(HP + (HP[1]))/2 + c2*(filt[1]) + c3*(filt[2]) Wave = (filt+filt[1]+filt[2])/3 Pwr = (filt*filt+filt[1]*filt[1]+filt[2]*filt[2])/3 sineWave = Wave / sqrt(Pwr) endif RETURN sineWave coloured(255,255,0) as "SineWave", OB as "Overbought level", OS as "Oversold level" |
Share this
No information on this site is investment advice or a solicitation to buy or sell any financial instrument. Past performance is not indicative of future results. Trading may expose you to risk of loss greater than your deposits and is only suitable for experienced investors who have sufficient financial means to bear such risk.
ProRealTime ITF files and other attachments :PRC is also on YouTube, subscribe to our channel for exclusive content and tutorials


