Understanding the Falling and Rising Three Methods
Before we get into the nitty-gritty of the code, let’s understand what the Falling and Rising Three Methods patterns are. These patterns are used to identify potential reversals in the market. The Falling Three Methods is a bearish continuation pattern, while the Rising Three Methods is a bullish continuation pattern. Both are composed of five candlesticks and are essential for predicting market trends.
Coding the Indicator
To begin, we need to identify the largest candle over the past 25 bars. This is achieved using the following code:
|
1 2 3 4 5 6 7 |
// Determine the largest candle of the last 25 bars with RANGE for i = 1 to 25 do DezeCandle = range[i] if DezeCandle > GrootsteCandle then GrootsteCandle = DezeCandle endif next |
This loop scans the last 25 bars and identifies the largest candle, storing its value in GrootsteCandle.
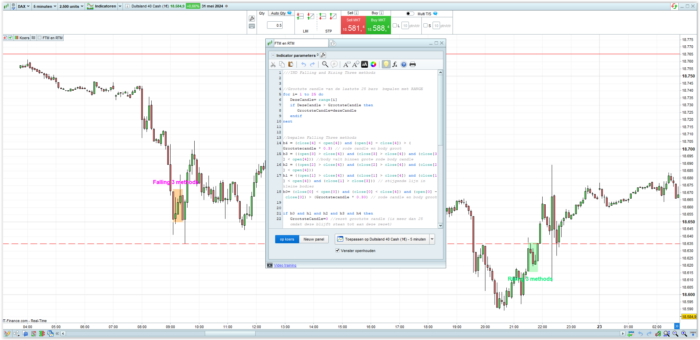
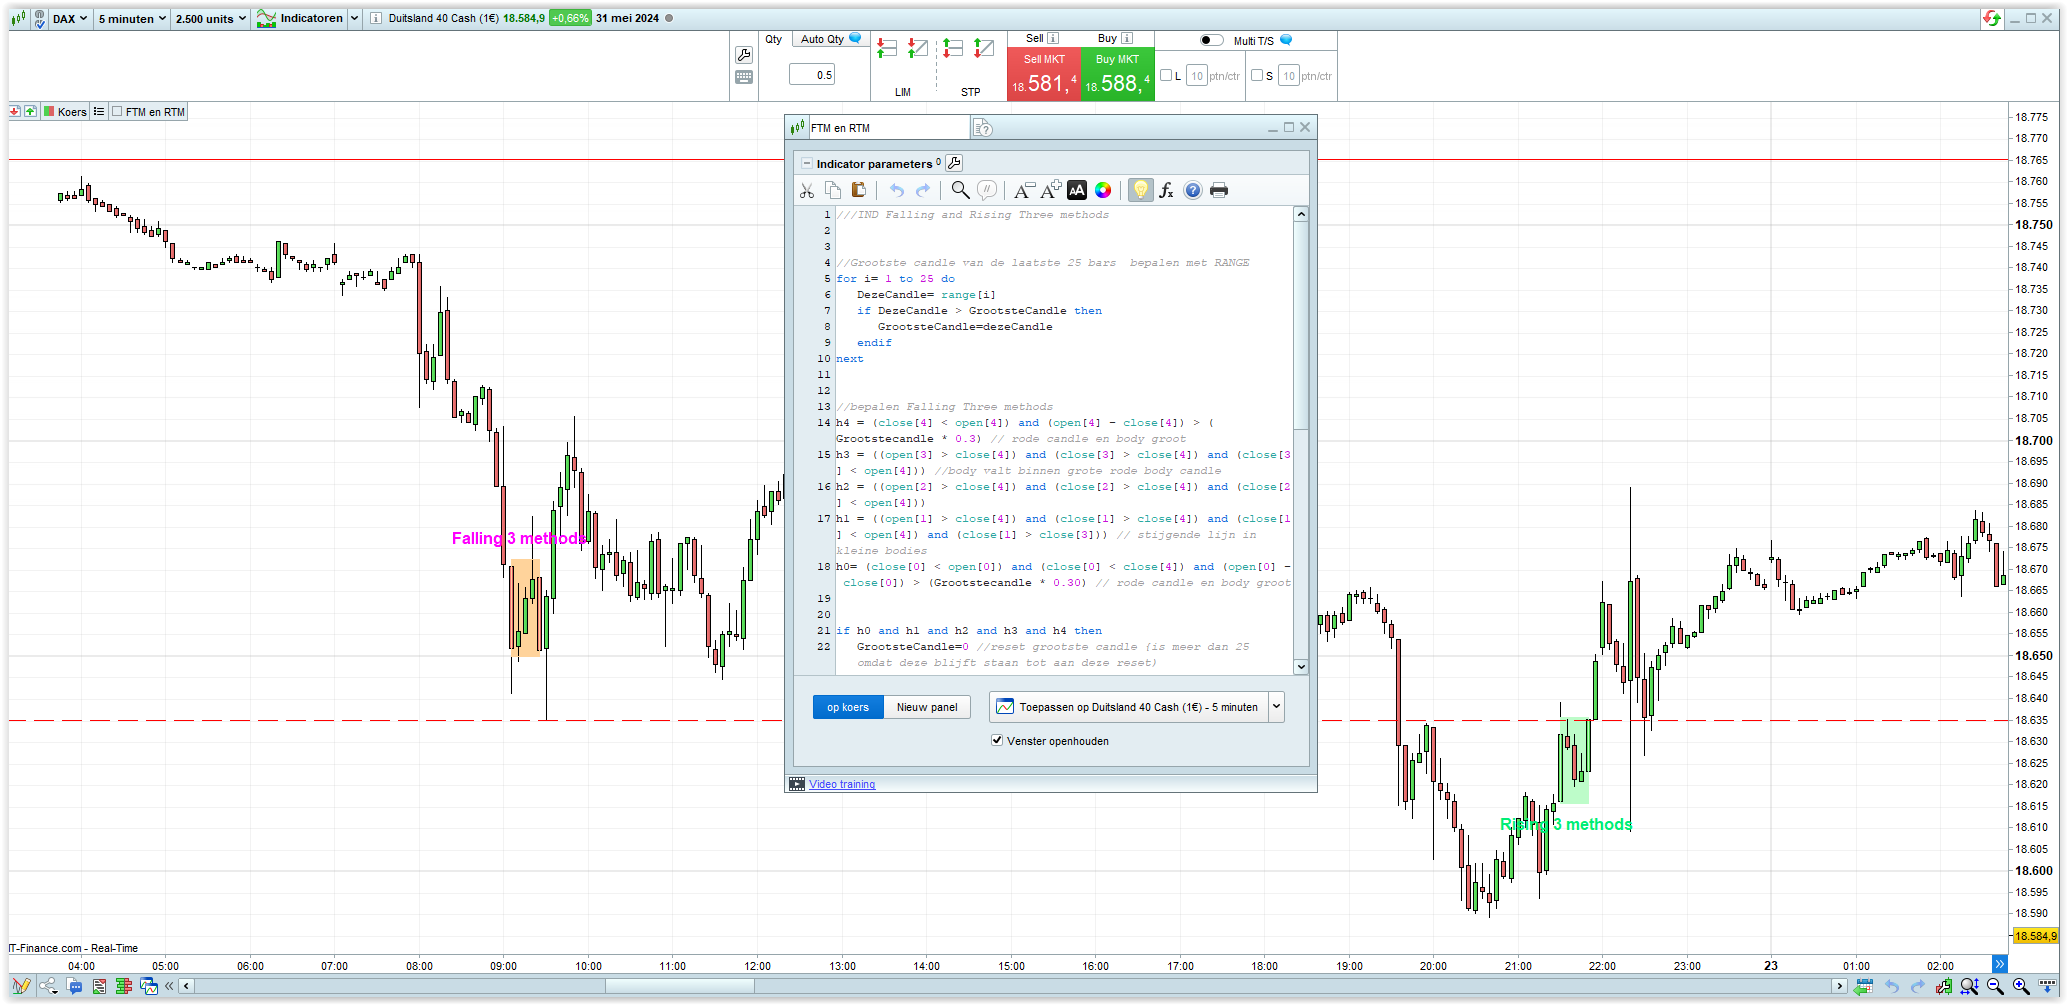
Falling Three Methods
Next, we define the conditions for the Falling Three Methods pattern:
|
1 2 3 4 5 6 7 8 9 10 11 12 |
// Determine Falling Three Methods h4 = (close[4] < open[4]) and (open[4] - close[4]) > (GrootsteCandle * 0.3) // large red candle h3 = (open[3] > close[4]) and (close[3] > close[4]) and (close[3] < open[4]) // body within large red candle h2 = (open[2] > close[4]) and (close[2] > close[4]) and (close[2] < open[4]) h1 = (open[1] > close[4]) and (close[1] > close[4]) and (close[1] < open[4]) and (close[1] > close[3]) // rising small bodies h0 = (close[0] < open[0]) and (close[0] < close[4]) and (open[0] - close[0]) > (GrootsteCandle * 0.30) // large red candle if h0 and h1 and h2 and h3 and h4 then GrootsteCandle = 0 // reset largest candle drawrectangle(barindex[4], high[4], barindex[0], low[0]) coloured(255,211,155) style(line, 1) bordercolor(255,211,155) // orange rectangle drawtext("Falling 3 methods", barindex[4], (high[4] + 2 * pipsize), SansSerif, Bold, 16) coloured(255,0,255) endif |
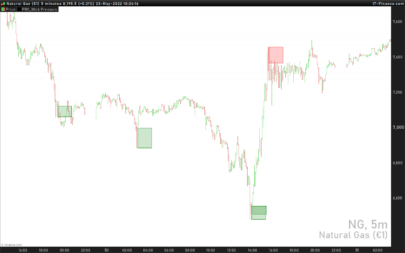
This code snippet checks if the specified conditions for the Falling Three Methods are met and then highlights the pattern on the chart with an orange rectangle and text.
Rising Three Methods
Similarly, we define the conditions for the Rising Three Methods pattern:
|
1 2 3 4 5 6 7 8 9 10 11 12 |
// Determine Rising Three Methods j4 = (close[4] > open[4]) and (close[4] - open[4]) > (GrootsteCandle * 0.3) // large green candle j3 = (open[3] < close[4]) and (close[3] < close[4]) and (close[3] > open[4]) // body within large green candle j2 = (open[2] < close[4]) and (close[2] < close[4]) and (close[2] > open[4]) j1 = (open[1] < close[4]) and (close[1] < close[4]) and (close[1] > open[4]) and (close[1] < close[3]) // falling small bodies j0 = (close[0] > open[0]) and (close[0] > close[4]) and (close[0] - open[0]) > (GrootsteCandle * 0.30) // large green candle if j0 and j1 and j2 and j3 and j4 then GrootsteCandle = 0 // reset largest candle drawrectangle(barindex[4], low[4], barindex[0], high[0]) coloured(189,252,201) style(line, 1) bordercolor(189,252,201) // green rectangle drawtext("Rising 3 methods", barindex[4], (low[4] - 2 * pipsize), SansSerif, Bold, 16) coloured(0,238,118) endif |
This code checks for the Rising Three Methods pattern and highlights it on the chart with a green rectangle and text.
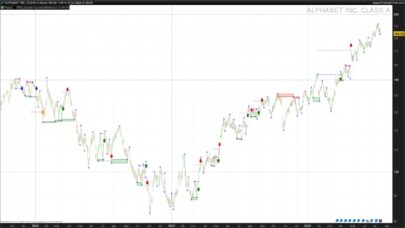
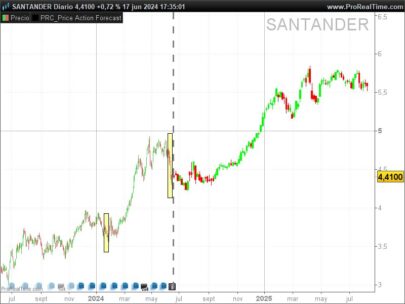
Practical Application
Integrating these patterns into your trading strategy can provide you with significant insights into market trends. The Falling Three Methods pattern helps you identify potential downtrends, while the Rising Three Methods pattern signals possible uptrends. By incorporating these indicators, you can make more informed trading decisions and potentially increase your profitability.
Conclusion
Mastering the Falling and Rising Three Methods indicator in ProRealTime can be a game-changer for your trading strategy. By understanding and implementing these patterns, you can enhance your market analysis and make more informed decisions. So, get coding and start leveraging these powerful indicators today!
If you have any questions or need further assistance, feel free to reach out. Happy trading!
Complete code:
|
1 2 3 4 5 6 7 8 9 10 11 12 13 14 15 16 17 18 19 20 21 22 23 24 25 26 27 28 29 30 31 32 33 34 35 36 37 38 39 40 41 42 43 44 45 46 |
///Falling and Rising Three methods //Grootste candle van de laatste 25 bars bepalen met RANGE for i= 1 to 25 do DezeCandle= range[i] if DezeCandle > GrootsteCandle then GrootsteCandle=dezeCandle endif next //bepalen Falling Three methods //////////////////////////////////// h4 = (close[4] < open[4]) and (open[4] - close[4]) > (Grootstecandle * 0.3) // rode candle en body groot h3 = ((open[3] > close[4]) and (close[3] > close[4]) and (close[3] < open[4])) //body valt binnen grote rode body candle h2 = ((open[2] > close[4]) and (close[2] > close[4]) and (close[2] < open[4])) h1 = ((open[1] > close[4]) and (close[1] > close[4]) and (close[1] < open[4]) and (close[1] > close[3])) // stijgende lijn in kleine bodies h0= (close[0] < open[0]) and (close[0] < close[4]) and (open[0] - close[0]) > (Grootstecandle * 0.30) // rode candle en body groot if h0 and h1 and h2 and h3 and h4 then GrootsteCandle=0 //reset grootste candle {is meer dan 25 omdat deze blijft staan tot aan deze reset) drawrectangle(barindex[4],high[4],barindex[0], low[0]) Coloured(255,211,155 )STYLE(line,1) bordercolor(255,211,155) ////oranje drawtext(" Falling 3 methods", barindex[4], (high[4]+ 2*pipsize),SansSerif,Bold,16)coloured(255,0,255) endif ///Rising three methods///////////////////////////////// ////////////////////////////////////////////////////// j4 = (close[4] > open[4]) and (close[4] - open[4]) > (Grootstecandle * 0.3) // groene candle en body groot j3 = ((open[3] < close[4]) and (close[3] < close[4]) and (close[3] > open[4])) //body valt binnen grote groene body candle j2 = ((open[2] < close[4]) and (close[2] < close[4]) and (close[2] > open[4])) j1 = ((open[1] < close[4]) and (close[1] < close[4]) and (close[1] > open[4]) and (close[1] < close[3])) // dalende lijn in kleine bodies j0= (close[0] > open[0]) and (close[0] > close[4]) and (close[0] - open[0]) > (Grootstecandle * 0.30) // groene candle en body groot if j0 and j1 and j2 and j3 and j4 then GrootsteCandle=0 //reset grootste candle {is meer dan 25 omdat deze blijft staan tot aan deze reset) drawrectangle(barindex[4],low[4],barindex[0], high[0]) Coloured(189,252,201)STYLE(line,1) bordercolor(189,252,201) ////groen drawtext(" Rising 3 methods", barindex[4], (low[4]- 2*pipsize),SansSerif,Bold,16)coloured(0,238,118) endif return |
Share this
No information on this site is investment advice or a solicitation to buy or sell any financial instrument. Past performance is not indicative of future results. Trading may expose you to risk of loss greater than your deposits and is only suitable for experienced investors who have sufficient financial means to bear such risk.
ProRealTime ITF files and other attachments :
Find other exclusive trading pro-tools on ![]()
PRC is also on YouTube, subscribe to our channel for exclusive content and tutorials


J’ai, télécharger le logiciel : falling-and-rising-3-methods.itf : rien se passe sur le graphique. Je ne comprends pas ; merci de t’ai explication.
C’est un modèle assez rare, essayez-le sur un petit laps de temps, par exemple 5 minutes et sur différents marchés
serait-il possible d avoir le code pour en daily et weekly ? merci bien