

False Breakout indicator
In this article, we will explore the False Breakout indicator (Zeiierman), a tool designed to identify false breakouts in the market. This indicator can help traders avoid false signals and make more informed decisions in their trading operations.
What is the False Breakout Indicator?
The False Breakout indicator is used to detect false breakouts in prices.
A false breakout occurs when the price appears to break a support or resistance level but then quickly returns within the previous range. This indicator is especially useful for traders looking to avoid false signals and improve the accuracy of their trades.
Input Parameters
The False Breakout uses several input parameters that can be adjusted to fit the trader’s needs:
- prd: Period used to calculate the highs and lows.
- minperiod: Minimum period between the last breakout and the current one.
- maxperiod: Maximum period allowed between the last breakout and the current one.
- smooth: Whether to smooth the high and low values.
- maType: Type of moving average to use (0 for simple moving average, 1 for exponential moving average, etc.).
- length: Length of the moving average.
How the Indicator Works
The False Breakout performs the following steps to identify false breakouts:
- Calculating New Highs and Lows: If the
smoothparameter is activated, the indicator calculates the average of the highs and lows using the specified moving average. If not, it simply takes the highs and lows of the specified period (prd). - Conditions for New Highs and Lows: The indicator checks if the new highs are higher than the previous ones and if the new lows are lower than the previous ones.
- Detection of False Breakouts: Using the above conditions, the indicator checks if the price has crossed below a recent low or above a recent high within the specified periods (
minperiodandmaxperiod).
How to Use the False Breakout
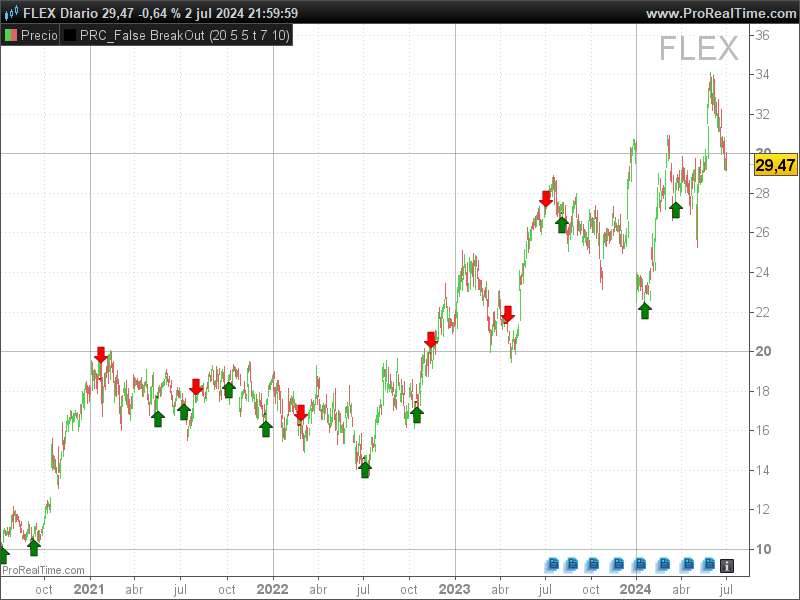
To use the False Breakout, traders should look for the arrow signals that appear on the chart:
- A red downward arrow indicates a false bullish breakout.
- A green upward arrow indicates a false bearish breakout.
These signals can help identify potential opportunities to enter or exit a position, thereby avoiding false breakouts.
Code
//------------------------------------------------------------------//
//PRC_False BreakOut
//version = 0
//03.07.2024
//Iván González @ www.prorealcode.com
//Sharing ProRealTime knowledge
//------------------------------------------------------------------//
//-----Inputs-------------------------------------------------------//
prd=20
minperiod=5
maxperiod=5
smooth=1
maType=0
length=10
//------------------------------------------------------------------//
//-----New High/Low-------------------------------------------------//
if smooth then
hi=average[length,maType](highest[prd](high))
lo=average[length,maType](lowest[prd](low))
else
hi=highest[prd](high)
lo=lowest[prd](low)
endif
condHi= hi>hi[1] and hi[1]<=hi[2]
condLo= lo<lo[1] and lo[1]>=lo[2]

if condHi then
if count>0 then
count=0
endif
idx1=idx0
count=count-1
val=low
idx0=barindex
endif

if condLo then
if count<0 then
count=0
endif
idx1=idx0
count=count+1
val=high
idx0=barindex
endif
//------------------------------------------------------------------//
//-----Conditions for BreakOut--------------------------------------//
minbars=idx1+minperiod < idx0
maxvalid=barindex-maxperiod <= idx0
//------------------------------------------------------------------//
breakdown=close crosses under val
breakup=close crosses over val
//------------------------------------------------------------------//
falsebreakoutUP=count<-1 and breakdown and maxvalid and minbars
falsebreakoutDN=count>1 and breakup and maxvalid and minbars
//------------------------------------------------------------------//
//-----Draw Signals-------------------------------------------------//
if falsebreakoutUP then
count=0
drawsegment(idx0,val,barindex,val)coloured("red")style(line,2)
drawarrowdown(barindex,high+0.5*averagetruerange[14])coloured("red")
elsif falsebreakoutDN then
count=0
drawsegment(idx0,val,barindex,val)coloured("green")style(line,2)
drawarrowup(barindex,low-0.5*averagetruerange[14])coloured("green")
endif
//------------------------------------------------------------------//
return
