Fibo Bands

v10.3
Fibo Bands

I hope you find it useful, in this post, I’ll explain my proposal to enhance Fibonacci levels, share the code, and the ready indicator attached for convenience.

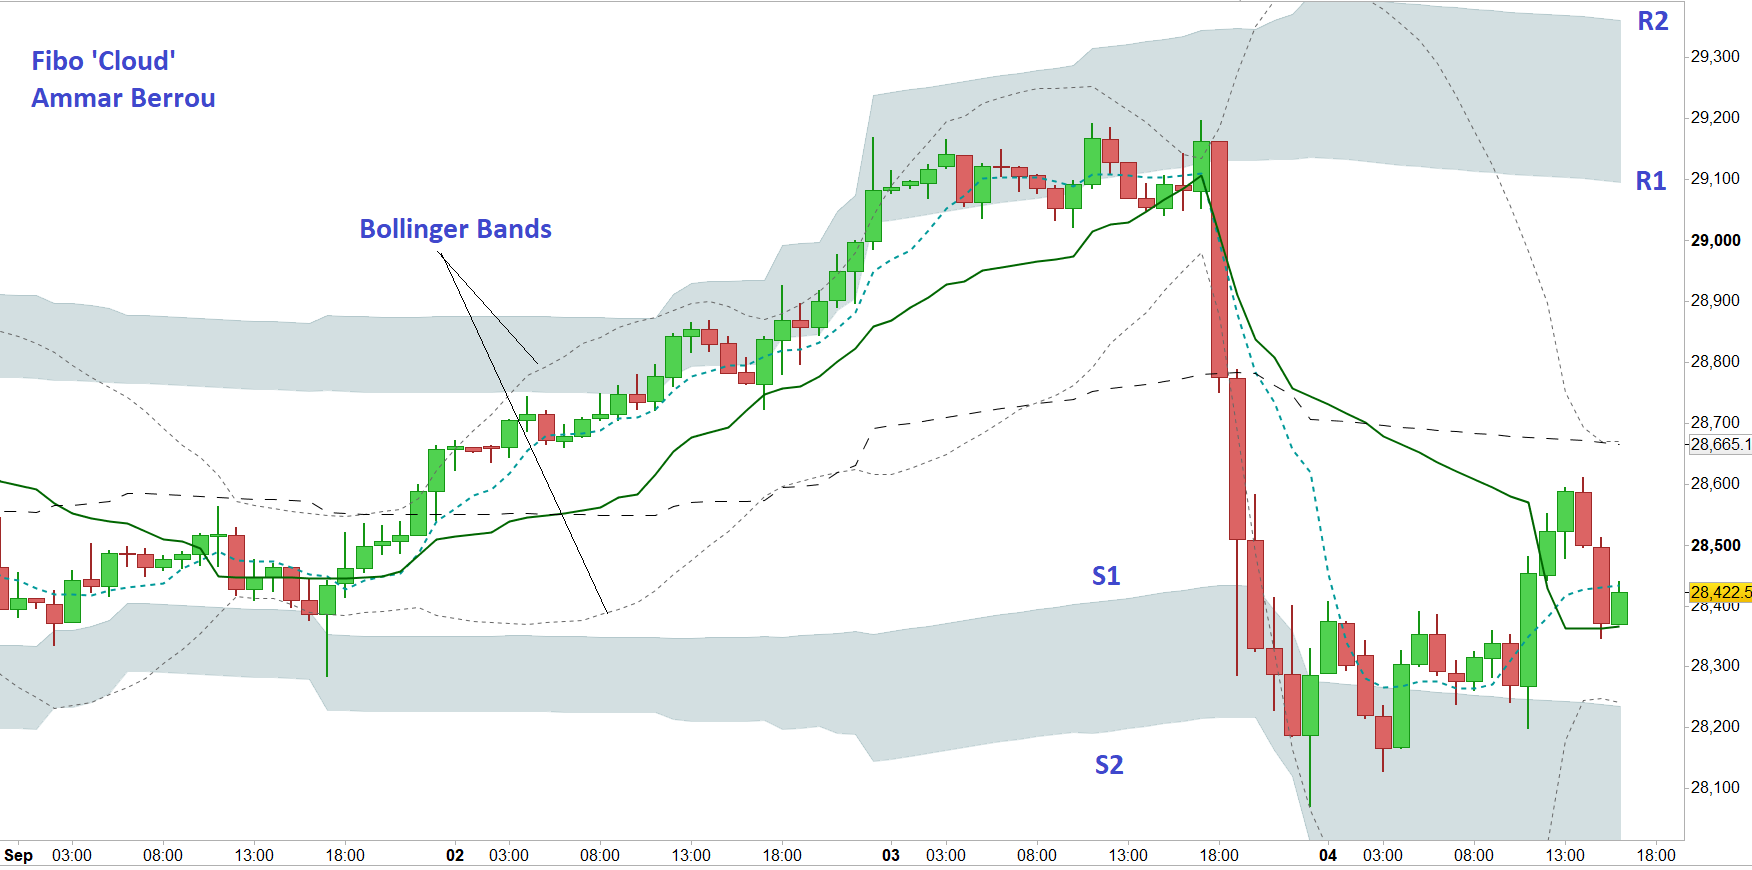
The image is DOW future Hourly chart (Fri 4th Sep), as you see the ‘Fibo Bands’ gives much better bounds to the market compared to Bollinger Bands,

For clarity I added a grey color fill between R1/R2 and S1/S2, the lower grey zone would be the ‘ground’ and the upper is the ‘cloud’.

Needless to say, the longer time frames (day, week) respects those boundaries even more, but it is stronger proof of my claim to use it on hourly chart.

Conventionally in Fibo levels, it is calculated for last price only, here it is continuous, and visually this one is easier to comprehend.

How to trade it: whenever the price reaches one of the grey zones look for a rebound (swing) or a new trend, a higher time frame would help, as usual wait for 2nd or 3rd confirmation, volume shall confirm the signal.

here’s the pro-real-time code:

Parameters:

extreme (boolean) to calculate the range based on open/close or high/low
History (integer) how many candles to search for the range, I suggest 50
Average (integer) average period, I suggest 30 to 50

reason I made History different from Average, is to allow the indicator to see more history than the average if needed.

You need a color fill between R1 & R2, S1 & S2
I usually hide S3, R3 and dif, less is more

Share this

Risk disclosure:

No information on this site is investment advice or a solicitation to buy or sell any financial instrument. Past performance is not indicative of future results. Trading may expose you to risk of loss greater than your deposits and is only suitable for experienced investors who have sufficient financial means to bear such risk.

ProRealTime ITF files and other attachments : How to import ITF files into ProRealTime platform?

PRC is also on YouTube, subscribe to our channel for exclusive content and tutorials

  1. mistersylv • 09/15/2020 #

    What parameter should we change to make another channel appear in the higher or lower time unit? make the H1 channel appear on an H4 graph for example

avatar
Register or

Likes

avatar avatar avatar avatar avatar avatar avatar avatar avatar avatar
Related users ' posts
Vonasi Yes that was the issue. I have posted an updated ITF file here: https://www.prorealcode.com/...
crolakstrading @vonasi Thank you for fixing the issue! This is a great indicator.
gregoire good evening vonasi , I had made the request to create this indicator a few years ago and I ...
Giogio hello dear Vonasi, thank you for your indicator, can I ask you for some help in order to let...
Pottar24 HI Vonasi I would like to know how can this algorithm give me the value of the last max e mi...
parthapersonal Hello Vonasi, Great work. Is it possible to replicate this to get values of "Price Line" (1...
tobytarczy Hi Vonasi, Sounds lovely, I race yachts around europe myself. Most regattas cancelled unfor...
mlouys Hello Vonasi thank for your work ! A question how can we do it for minutes ( or 15 min or x ...
Vonasi I think that would be possible but probably in a whole new indicator as detecting when a new...
thierrybl Thanks a lot
B-ling1 Hi Vonasi, I love this indicator - good job! Just one question: If I want the monthly OHLC L...
ezman Copy and paste this code, don't work. error!
datageek How do I change the thickness of the line or change it too dashed lines? Kind regards
lkiklkik NE fonctionne pas ( ou plus ... )
Nicolas il faut modifier toutes les références à top par itop et bottom par ibottom. Ces mots étant ...
Nicolas Add indicator on price doesnt require any specific type of subcription. Click on the wrench ...
tahiti bonjour j'ai une petite question comment peux on enlevé la bar blanche sur la bougie en cour...
sixeight Hi Kris, is there a way to increase the number of rows? I get a loop error
Kris75 Hi, This is great !! anyone ever developped a strategy about it ???
swapping hello Kris75, not that I know but it is possible to make a scenario ;)
digitation Hi swapping, Thanks for sharing this useful tool. I was wondering how difficult it would be...
Vonasi There is another version of this indicator that can plot the same lines but onto an indicato...
Martin35 Hello Vonasi, do you think it is possible with PRT to code with the same principle as on thi...
abhay I am getting a shading between the lines, how can I avoid that. I just want to see lines as ...
Vonasi Delete the 'Color Zone' in the indicator settings window.
Nicolas
6 years ago
Hans63 Thank you swapping
FREDNC @Nicolas merci pour se remarquable indicateur, reste à voir comment on va pourvoir l'intégre...
Diamant Bonjour à vous tous, D'après vous, quelle serais la bonne période pour du trading 15 minute...
swapping fib1236 = (hiday-lowday)*1.236+lowday DrawSegment(startbar,fib1236,barindex,fib1236) colou...
swapping Oups ! Nicolas il y a un problème avec l'insertion de code en utilisant le bouton [Add PRT ...
swapping fib1236 = (hiday-lowday)*1.236+lowday DrawSegment(startbar,fib1236,barindex,fib1236) colour...
mathiasKN Steffen Schmauch • 12/11/2018 # hello Nicolas, can I change the indicator that I only get t...
Nicolas Please open a new topic in the indicator forum and explain there your query, thank you.
upupandaway This seems like a very useful indicator. However, it does not seem to open properly in the c...
mscharstrom Hi @robertogozzi, I really love this indicator. However, I'd like to tinker with it to fit ...
Ahimsa Hi Roberto I cannot thank you enough for writing this code. It could help me more than you ...
Nicolas With PRT v11, you have to click on "price" at the upper left side of the price chart.
Nicolas Sure, I suggest you open a new topic in the forum to discuss about your ideas.
hdgm Bonjour Nicolas, est ce que l'on peut en faire une stratégie de trading automatisée ?
Nicolas Non, pas en utilisant l'indicateur zigzag traditionnel de la plateforme.
Gianluca ok i fixed it i hope is ok like this: //TAC trader zone 10.2 | indicator //01.01.2018 //R...
TAC Bolsa Hello try this new version or view the blog with the new indicators .. https://www.t...
TAC Bolsa Sorry, TAC Trader Zone V2 https://www.tiburonesdealetacorta.com/2018/11/indicador-tac-tr...
FULVIO09 Attualmente non c'è sufficiente volatilità : la condizione "C0 = AverageTrueRange[1500](Clos...
vlongobardo67 Ma io intendevo in backtest ! Scusa non l’ho menzionato.
ciniselloftse salve fulvio .il trading sistem e sempre profittevole?
cervantes2 Buenas tardes y gracias por este magnifico indicador. Queria saber si tienes un proscreener ...
cervantes2 Que busque los valores que la linea verde acaba de cruzar al alza o a la baja
AngelPujalt Tenéis algún screener de este indicador?
Yannick Hello There is a mistake in trailing stop code, I think that this should fix the problem s...
Paul About the trailing-stop the way it's coded. That works for backtesting only, just look at th...
Jonny sorry paul, but system says that is not possible to put many stop order combined...what have...
s00071609 I am using this indicator but it keep crashing as i change the timeframe. For example, chang...
Nicolas in the mean time you can try this one: https://www.prorealcode.com/prorealtime-indicators/ho...
Gianluca Is it possible to have an indicator where those value are as instogram ? and separated? in o...

Top