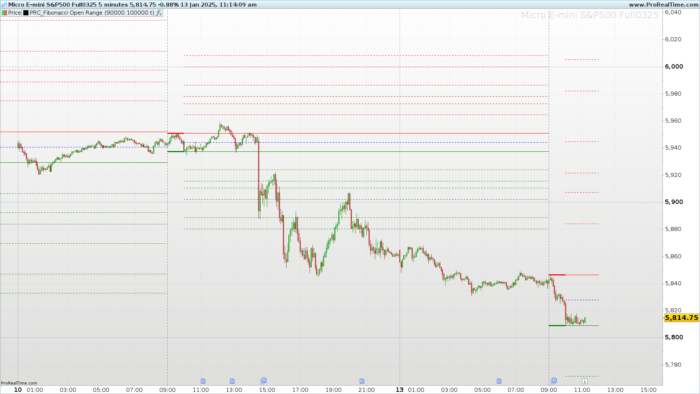
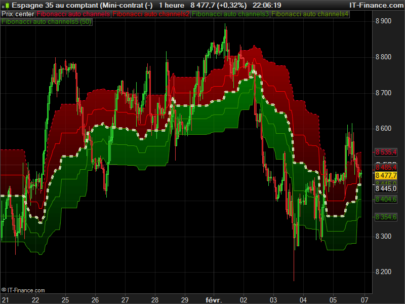
The Fibonacci Opening Range (FOR) is a technical indicator that uses the market’s opening session to define key support and resistance levels based on Fibonacci ratios. This indicator helps traders identify high-probability zones for potential reversals or trend continuations by analyzing the initial movement of the trading session.
1. What is the Fibonacci Opening Range?
The opening range refers to the highest and lowest prices reached during the first minutes or hours of the trading session. These levels are essential as they often mark significant support and resistance areas for the rest of the day.
The Fibonacci Opening Range indicator extends these levels using Fibonacci ratios such as 1.618 and 2.618 to project potential price extensions above and below the range.
2. How the FOR Indicator Works
The indicator follows these steps:
- Defining the Opening Range: It calculates the highest and lowest points during a specified time range (e.g., the first 30 minutes of the session).
- Calculating Extensions: The width of the range is used to compute Fibonacci-based levels above and below:
- 1.0 (baseline level)
- 1.618, 2.618, 4.236, etc. (extension levels)
- Visualization: The Fibonacci levels are plotted as horizontal lines on the chart, with a colored cloud highlighting the zone between the range’s high and low.
3. Indicator Configuration
The FOR indicator includes customizable settings for a more personalized experience:
ORBegin: Start time of the opening range (e.g., 9:00 AM).OREnd: End time of the opening range (e.g., 10:00 AM).ShowpastFibo: Option to display Fibonacci extensions throughout the day.- Fibonacci Extensions: You can toggle specific levels (e.g., 1.618 or 2.618) on or off (with //)
4. Interpreting the Fibonacci Levels
Fibonacci levels provide critical information about potential price movements:
- Level 1.0: Marks the high and low of the opening range.
- 1.618 and 2.618: Common target levels when the price breaks the opening range.
- 4.236: A less common but valuable level during high-volatility periods.
5. Advantages of Using the FOR Indicator
- Identifies Key Breakout Points: Helps quickly spot potential breakouts from the opening range.
- Risk Management: Provides clear levels for setting stop-losses and take-profits.
- Versatility: Suitable for both intraday and swing trading strategies.
6. ProBuilder Code for ProRealTim
|
1 2 3 4 5 6 7 8 9 10 11 12 13 14 15 16 17 18 19 20 21 22 23 24 25 26 27 28 29 30 31 32 33 34 35 36 37 38 39 40 41 42 43 44 45 46 47 48 49 50 51 52 53 54 55 56 57 58 59 60 61 62 63 64 65 66 67 68 69 70 71 72 73 74 75 76 77 78 79 80 81 82 83 84 85 86 87 88 |
//--------------------------------------------// //PRC_Fibonacci Open Range //version = 0 //13.01.2025 //Iván González @ www.prorealcode.com //Sharing ProRealTime knowledge //--------------------------------------------// // inputs //--------------------------------------------// //ORBegin=090000 //OREnd=100000 //ShowpastFibo=1 //--------------------------------------------// // Calculate Open Range //--------------------------------------------// if gettimeframe<=3600 then once ORHigh=0 once ORLow=9999999 // Puntos de Fibonacci ORWidth = ORHigh - ORLow FibMid = (ORHigh + ORLow) / 2 FibExtUp1 = ORHigh + ORWidth * (1.0) FibExtDown1 = ORLow - ORWidth * (1.0) FibExtUp2 = ORHigh + ORWidth * (1.618) FibExtDown2 = ORLow - ORWidth * (1.618) FibExtUp3 = ORHigh + ORWidth * (2.0) FibExtDown3 = ORLow - ORWidth * (2.0) FibExtUp4 = ORHigh + ORWidth * (2.618) FibExtDown4 = ORLow - ORWidth * (2.618) FibExtUp5 = ORHigh + ORWidth * (3.618) FibExtDown5 = ORLow - ORWidth * (3.618) FibExtUp6 = ORHigh + ORWidth * (4.236) FibExtDown6 = ORLow - ORWidth * (4.236) if opentime>=ORBegin and opentime[1]<ORBegin then drawsegment(OREndIdx,ORHigh,barindex,ORHigh)coloured("red")style(line,1) drawsegment(OREndIdx,ORLow,barindex,ORLow)coloured("green")style(line,1) drawsegment(OREndIdx,FibMid,barindex,FibMid)coloured("blue")style(dottedline,1) drawsegment(OREndIdx,ORLow,barindex,ORLow)coloured("green")style(line,1) if ShowpastFibo then drawsegment(OREndIdx,FibExtDown1,barindex,FibExtDown1)coloured("green")style(dottedline,1) drawsegment(OREndIdx,FibExtDown2,barindex,FibExtDown2)coloured("green")style(dottedline,1) drawsegment(OREndIdx,FibExtDown3,barindex,FibExtDown3)coloured("green")style(dottedline,1) drawsegment(OREndIdx,FibExtDown4,barindex,FibExtDown4)coloured("green")style(dottedline,1) drawsegment(OREndIdx,FibExtDown5,barindex,FibExtDown5)coloured("green")style(dottedline,1) drawsegment(OREndIdx,FibExtDown6,barindex,FibExtDown6)coloured("green")style(dottedline,1) drawsegment(OREndIdx,FibExtUp1,barindex,FibExtUp1)coloured("red")style(dottedline,1) drawsegment(OREndIdx,FibExtUp2,barindex,FibExtUp2)coloured("red")style(dottedline,1) drawsegment(OREndIdx,FibExtUp3,barindex,FibExtUp3)coloured("red")style(dottedline,1) drawsegment(OREndIdx,FibExtUp4,barindex,FibExtUp4)coloured("red")style(dottedline,1) drawsegment(OREndIdx,FibExtUp5,barindex,FibExtUp5)coloured("red")style(dottedline,1) drawsegment(OREndIdx,FibExtUp6,barindex,FibExtUp6)coloured("red")style(dottedline,1) endif ORHigh=high ORLow=low ORBeginIdx=barindex drawvline(barindex)style(dottedline3)coloured("grey") elsif opentime>=ORBegin and opentime<=OREnd then ORHigh=max(ORHigh,high) ORLow=min(ORLow,low) elsif opentime>OREnd and opentime[1]<=OREnd then OREndIdx=barindex[1] drawsegment(ORBeginIdx,ORHigh,OREndIdx,ORHigh)coloured("red")style(line,3) drawsegment(ORBeginIdx,ORLow,OREndIdx,ORLow)coloured("green")style(line,3) elsif islastbarupdate then drawsegment(barindex+10,ORHigh,OREndIdx,ORHigh)coloured("red")style(line,1) drawsegment(barindex+10,ORLow,OREndIdx,ORLow)coloured("green")style(line,1) drawsegment(OREndIdx,FibMid,barindex+10,FibMid)coloured("blue")style(dottedline,1) drawsegment(OREndIdx,ORLow,barindex+10,ORLow)coloured("green")style(line,1) drawsegment(OREndIdx,FibExtDown1,barindex+10,FibExtDown1)coloured("green")style(dottedline,1) drawsegment(OREndIdx,FibExtDown2,barindex+10,FibExtDown2)coloured("green")style(dottedline,1) drawsegment(OREndIdx,FibExtDown3,barindex+10,FibExtDown3)coloured("green")style(dottedline,1) drawsegment(OREndIdx,FibExtDown4,barindex+10,FibExtDown4)coloured("green")style(dottedline,1) drawsegment(OREndIdx,FibExtDown5,barindex+10,FibExtDown5)coloured("green")style(dottedline,1) drawsegment(OREndIdx,FibExtDown6,barindex+10,FibExtDown6)coloured("green")style(dottedline,1) drawsegment(OREndIdx,FibExtUp1,barindex+10,FibExtUp1)coloured("red")style(dottedline,1) drawsegment(OREndIdx,FibExtUp2,barindex+10,FibExtUp2)coloured("red")style(dottedline,1) drawsegment(OREndIdx,FibExtUp3,barindex+10,FibExtUp3)coloured("red")style(dottedline,1) drawsegment(OREndIdx,FibExtUp4,barindex+10,FibExtUp4)coloured("red")style(dottedline,1) drawsegment(OREndIdx,FibExtUp5,barindex+10,FibExtUp5)coloured("red")style(dottedline,1) drawsegment(OREndIdx,FibExtUp6,barindex+10,FibExtUp6)coloured("red")style(dottedline,1) else ORHigh=ORHigh ORLow=ORLow endif endif //--------------------------------------------// return |
Share this
No information on this site is investment advice or a solicitation to buy or sell any financial instrument. Past performance is not indicative of future results. Trading may expose you to risk of loss greater than your deposits and is only suitable for experienced investors who have sufficient financial means to bear such risk.
ProRealTime ITF files and other attachments :
Find other exclusive trading pro-tools on ![]()
PRC is also on YouTube, subscribe to our channel for exclusive content and tutorials


Mira que has hecho unos cuantos indicadores,pues este los supera a todos.Brillante.