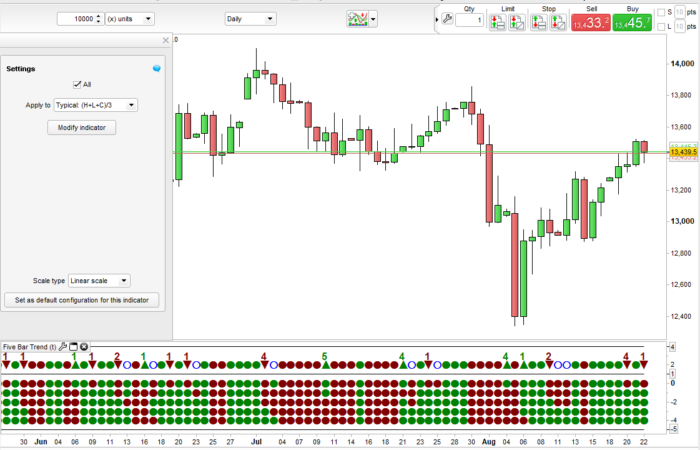
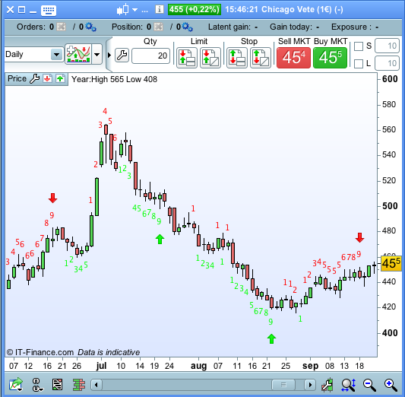
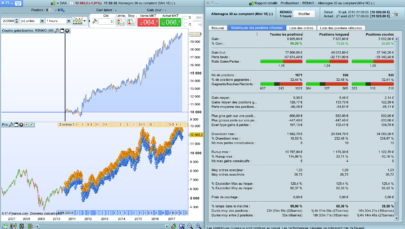
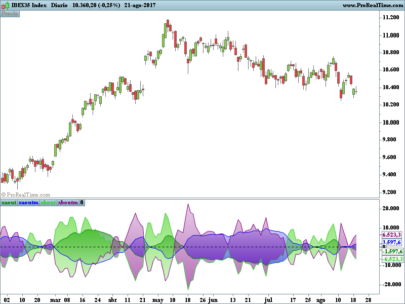
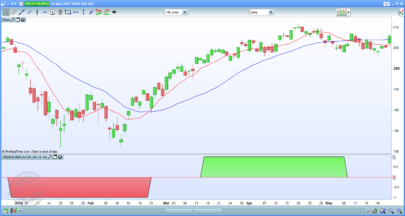
This indicator creates a dashboard of dots to show the trend in five time frames.
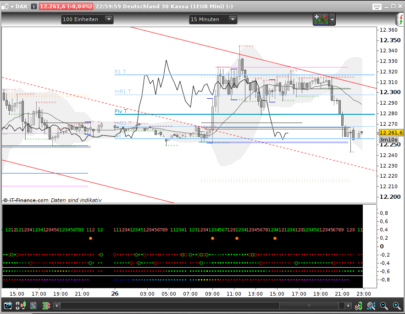
So for example on a 5 minute time frame it calculates what a 5 minute, 10 minute, 15 minute, 20 minute and 25 minute candle would be and on a daily chart it would calculate what 1 day, 2 day, 3 day, 4 day and 5 day candles would be. It then compares the current price to those candles. It can the compare closing price to the open, median price, typical price, total price and weighted close price. It then draws five dots to show whether the comparison is down or up for each time frame. The upper of the five dots represents the fastest time frame candle comparison (so 5 minutes on a 5 minute chart) and the lowest dot is the slowest comparison (so 25 minutes on a 5 minute chart).
The separate upper row shows a red dot if all the time frame dots below are red and a green dot is all the time frame dots below are green. If they are mixed then an empty blue circle is drawn. If a set of 5 red or 5 green dots is followed by a mixed row of dots then an up arrow or down arrow is shown to highlight a possible market reversal after a strong trend. The number above this arrow highlights how long the previous run of five same colour dots has gone on for. This number can help analyse how strong the run was and can be used for position sizing or just to assist in deciding how likely a reversal is to be.
Change the price that you compare to by changing the ‘customclose’ value in the indicator window. If you select open,close,high or low then the comparison is always open to close. The others are close to typical price or close to median price etc.
By ticking or unticking ‘All’ you can remove the dots representing the five time frames. This allows the indicator to be reduced down in size so as to take up less chart space.
I suggest downloading and importing the ITF file to get full functionality.
|
1 2 3 4 5 6 7 8 9 10 11 12 13 14 15 16 17 18 19 20 21 22 23 24 25 26 27 28 29 30 31 32 33 34 35 36 37 38 39 40 41 42 43 44 45 46 47 48 49 50 51 52 53 54 55 56 57 58 59 60 61 62 63 64 65 66 67 68 69 70 71 72 73 74 75 76 77 78 79 80 81 82 83 84 85 86 87 88 89 90 91 92 93 94 95 96 97 98 99 100 101 102 103 104 105 106 107 108 109 110 111 112 113 114 115 116 117 118 119 120 121 122 123 124 125 126 127 128 129 130 131 132 133 134 135 136 137 138 139 140 141 142 143 144 145 146 147 148 149 150 151 152 153 154 155 156 157 158 159 160 161 162 163 164 165 166 167 168 169 170 |
//Five Bar Trend //By Vonasi //20190822 m5 = customclose m10h = highest[2](high) m10l = lowest[2](low) m10o = open[1] m15h = highest[3](high) m15l = lowest[3](low) m15o = open[2] m20h = highest[4](high) m20l = lowest[4](low) m20o = open[3] m25h = highest[5](high) m25l = lowest[5](low) m25o = open[4] if customclose = typicalprice then m10 = (m10h + m10l + close)/3 m15 = (m15h + m15l + close)/3 m20 = (m20h + m20l + close)/3 m25 = (m25h + m25l + close)/3 endif if customclose = medianprice then m10 = (m10h + m10l)/2 m15 = (m15h + m15l)/2 m20 = (m20h + m20l)/2 m25 = (m25h + m25l)/2 endif if customclose = totalprice then m10 = (m10h + m10l + m10o + close)/4 m15 = (m15h + m15l + m15o + close)/4 m20 = (m20h + m20l + m20o + close)/4 m25 = (m25h + m25l + m25o + close)/4 endif if customclose = weightedclose then m10 = (m10h + m10l + (2 * close))/4 m15 = (m15h + m15l + (2 * close))/4 m20 = (m20h + m20l + (2 * close))/4 m25 = (m25h + m25l + (2 * close))/4 endif if customclose = close or customclose = open or customclose = high or customclose = low then m5 = open m10 = m10o m15 = m15o m20 = m20o m25 = m25o endif up = 0 down = 0 if close < m5 then if all then drawtext("●",barindex,0,SansSerif,Bold,16)coloured(128,0,0) endif down = down + 1 endif if close > m5 then if all then drawtext("●",barindex,0,SansSerif,Bold,16)coloured(0,128,0) endif up = up + 1 endif if close < m10 then if all then drawtext("●",barindex,-1,SansSerif,Bold,16)coloured(128,0,0) endif down = down + 1 endif if close > m10 then if all then drawtext("●",barindex,-1,SansSerif,Bold,16)coloured(0,128,0) endif up = up + 1 endif if close < m15 then if all then drawtext("●",barindex,-2,SansSerif,Bold,16)coloured(128,0,0) endif down = down + 1 endif if close > m15 then if all then drawtext("●",barindex,-2,SansSerif,Bold,16)coloured(0,128,0) endif up = up + 1 endif if close < m20 then if all then drawtext("●",barindex,-3,SansSerif,Bold,16)coloured(128,0,0) endif down = down + 1 endif if close > m20 then if all then drawtext("●",barindex,-3,SansSerif,Bold,16)coloured(0,128,0) endif up = up + 1 endif if close < m25 then if all then drawtext("●",barindex,-4,SansSerif,Bold,16)coloured(128,0,0) endif down = down + 1 endif if close > m25 then if all then drawtext("●",barindex,-4,SansSerif,Bold,16)coloured(0,128,0) endif up = up + 1 endif if down = 5 then drawtext("●",barindex,2,SansSerif,Bold,16)coloured(128,0,0) dcount = dcount + 1 ucount = 0 endif if up = 5 then drawtext("●",barindex,2,SansSerif,Bold,16)coloured(0,128,0) dcount = 0 ucount = ucount + 1 endif if not all then top = 4 middle = 1 bottom = 1 else top = 4 middle = 1 bottom = -5 endif flag = 0 if down[1] = 5 and down <> 5 and up <> 5 then drawtext("▲",barindex,2,SansSerif,Bold,16)coloured(0,128,0) a = dcount[1] drawtext("#a#",barindex,3,SansSerif,Bold,16)coloured(0,128,0) dcount = 0 flag = 1 endif if up[1] = 5 and down <> 5 and up <> 5 then drawtext("▼",barindex,2,SansSerif,Bold,16)coloured(128,0,0) a = ucount[1] drawtext("#a#",barindex,3,SansSerif,Bold,16)coloured(128,0,0) ucount = 0 flag = 1 endif if flag = 0 and up <> 5 and down <> 5 then drawtext("○",barindex,2,SansSerif,Bold,16)coloured(0,0,255) endif return top,middle,bottom |
Share this
No information on this site is investment advice or a solicitation to buy or sell any financial instrument. Past performance is not indicative of future results. Trading may expose you to risk of loss greater than your deposits and is only suitable for experienced investors who have sufficient financial means to bear such risk.
ProRealTime ITF files and other attachments :
Find other exclusive trading pro-tools on ![]()
PRC is also on YouTube, subscribe to our channel for exclusive content and tutorials


hello, thank you that seems very useful. I will try it.
Hello Vonasi Its seem a nice job again thanks
Dear Vonasi, thanks for a truly great indicator! Forgive me, but I tried to edit your flawless code so I could implement it in Autotrading, but I obviously failed. Anyone care to elaborate what I am doing wrong?
I tried to use “Add PRT code”, but failed why I paste the code directly.
//————————————————————————-
defparam cumulateorders=false
Defparam preloadbars=10000
//————————————————————————-
//Settings of orders
amount = 100 //quantity of shares/contracts to open for each new order
//————————————————————————-
//Indicators
//Indicator type: Candle trend in 5 different time frames
//Edited code originates from: Five Bar Trend
//Author: Vonasi
//Date: 20190822
//Source: https://www.prorealcode.com/prorealtime-indicators/five-bar-trend-dashboard/
m5 = customclose
//m5=typicalprice
//m5=medianprice
//m5=totalprice
//m5=weightedclose
//m5=(close or customclose = open or customclose = high or customclose = low)
m10h = highest[2](high)
m10l = lowest[2](low)
m10o = open[1]
m15h = highest[3](high)
m15l = lowest[3](low)
m15o = open[2]
m20h = highest[4](high)
m20l = lowest[4](low)
m20o = open[3]
m25h = highest[5](high)
m25l = lowest[5](low)
m25o = open[4]
if customclose = typicalprice then
m10 = (m10h + m10l + close)/3
m15 = (m15h + m15l + close)/3
m20 = (m20h + m20l + close)/3
m25 = (m25h + m25l + close)/3
endif
if customclose = medianprice then
m10 = (m10h + m10l)/2
m15 = (m15h + m15l)/2
m20 = (m20h + m20l)/2
m25 = (m25h + m25l)/2
endif
if customclose = totalprice then
m10 = (m10h + m10l + m10o + close)/4
m15 = (m15h + m15l + m15o + close)/4
m20 = (m20h + m20l + m20o + close)/4
m25 = (m25h + m25l + m25o + close)/4
endif
if customclose = weightedclose then
m10 = (m10h + m10l + (2 * close))/4
m15 = (m15h + m15l + (2 * close))/4
m20 = (m20h + m20l + (2 * close))/4
m25 = (m25h + m25l + (2 * close))/4
endif
if customclose = close or customclose = open or customclose = high or customclose = low then
m5 = open
m10 = m10o
m15 = m15o
m20 = m20o
m25 = m25o
endif
//Line 1, First time frame
//Red dot
if close m5 then
L1=1
up = up + 1
endif
//Line 2, Second time frame
//Red dot
if close m10 then
L2=1
up = up + 1
endif
//Line 3, Third time frame
//Red dot
if close m15 then
L3=1
up = up + 1
endif
//Line 4, Fourth time frame
//Red dot
if close m20 then
L4=1
up = up + 1
endif
//Line 5, Fifth time frame
//Red dot
if close m25 then
L5=1
up = up + 1
endif
//Market reversal
//Down
if up[1] = 5 and down 5 and up 5 then
reda = ucount[1]
ucount = 0
Arrow=-1
endif
//Up
if down[1] = 5 and down 5 and up 5 then
greena = dcount[1]
dcount = 0
Arrow=1
endif
BullCandle5=((L1=1)and(L2=1)and(L3=1)and(L4=1)and(L5=1)) or ((Arrow=1) and (greena>=3))
BearCandle5=((L1=-1)and(L2=-1)and(L3=-1)and(L4=-1)and(L5=-1)) or ((Arrow=-1) and (reda>=3))
//Conditions when to act
if (not longonmarket and BullCandle5) then
buy amount shares at market
endif
if (longonmarket and BearCandle5 and positionperf>0) then
sell at market
endif
soulintact – this is probably not the best place to discuss a strategy version of the indicator. I would suggest starting a topic in the ProOrder forum so that we can all discuss the idea.
Of course Vonasi. Done! https://www.prorealcode.com/topic/rewriting-an-idicator-to-pro-order/
Hello, where can I get a list of possible objects and their formulations to insert in the Dashboard (Square, Circle, Triangle etc …) Thank you
I use the Windows10 ‘Character Map’. Type it in your windows search box.
@Vonasi Thanks
how to convert to afl amibroker ?
We do not supply free coding assistance for AFL Amibroker on the website. You can ask for paid programming at: https://www.prorealcode.com/trading-programming-services/
@ Vonasi,
how to use timeframe , 13 minutes ,21 minutes, 34 minutes,et 55 minutes with this program?
Thanks,