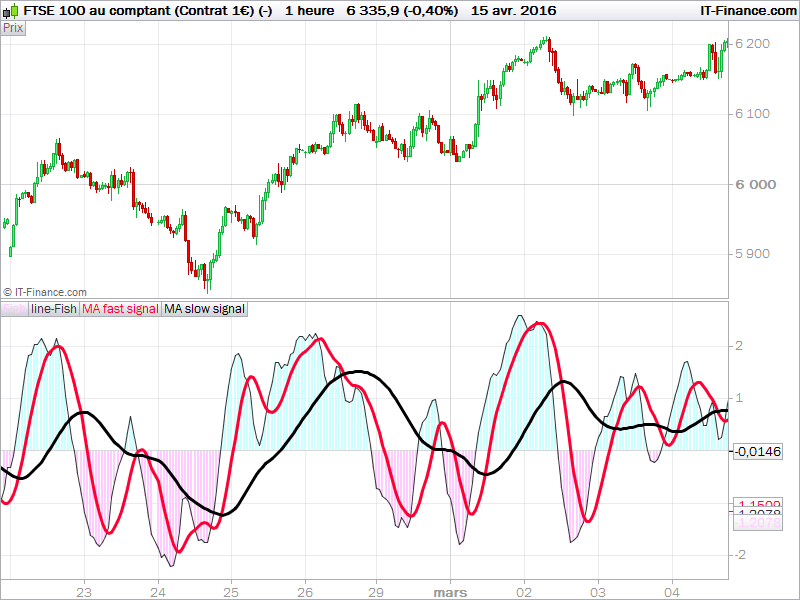
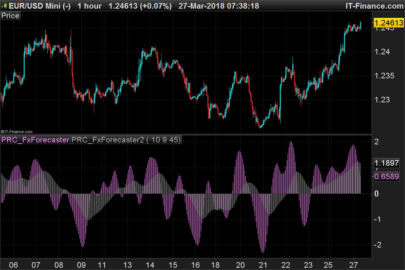
I found this indicator has some utility for some forex traders around here. I translated this code from another trading platform to prorealtime for the benefit of everyone on our site. This indicator is made of a recent highest and lowest (10 periods default) passed into a fisher transform filter. Then a simple moving average is set other this value to generate signals like a MACD. Another weighted moving average smooth the whole value to act like an overall trend.
Of course because of average smoothing, signals maybe too late. You can play with period of highest/lowest looback, as well of the 2 moving average.
|
1 2 3 4 5 6 7 8 9 10 11 12 13 14 15 16 17 |
period = 10 MA1period=9 MA2period=45 MaxH = highest[period](high) MinL = lowest[period](low) price = customclose if(barindex>MA2period) then Value = 0.33*2*((price-MinL)/(MaxH-MinL)-0.5) + 0.67*Value[1] Fish = 0.5*LOG((1+Value)/(1-Value))+0.5*Fish[1] MA1 = Average[MA1period](Fish) MA2 = WeightedAverage[MA2period](MA1) endif RETURN Fish as "Fish", Fish as "line-Fish", MA1 as "MA fast signal",MA2 as "MA slow signal" |
Share this
No information on this site is investment advice or a solicitation to buy or sell any financial instrument. Past performance is not indicative of future results. Trading may expose you to risk of loss greater than your deposits and is only suitable for experienced investors who have sufficient financial means to bear such risk.
ProRealTime ITF files and other attachments :PRC is also on YouTube, subscribe to our channel for exclusive content and tutorials


Hello Nicolas, thanks for posting this Fisher Transform code. I was reading John Ehler’s MESA site and found this averaging crossover/under method at the very bottom of his article: https://www.mesasoftware.com/papers/UsingTheFisherTransform.pdf
“This suggests the use of a momentum function to identify the major turning points. Since a 10 bar channel is used, I multiplied the rate of change of the Fisher Transform by 10 and plotted this amplified rate of change over the Fisher Transform in the subgraph of Figure 6”
Can this be added to this indicator?
Cheers!