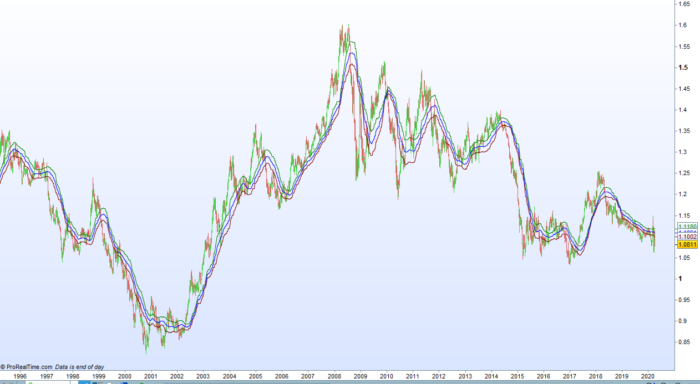
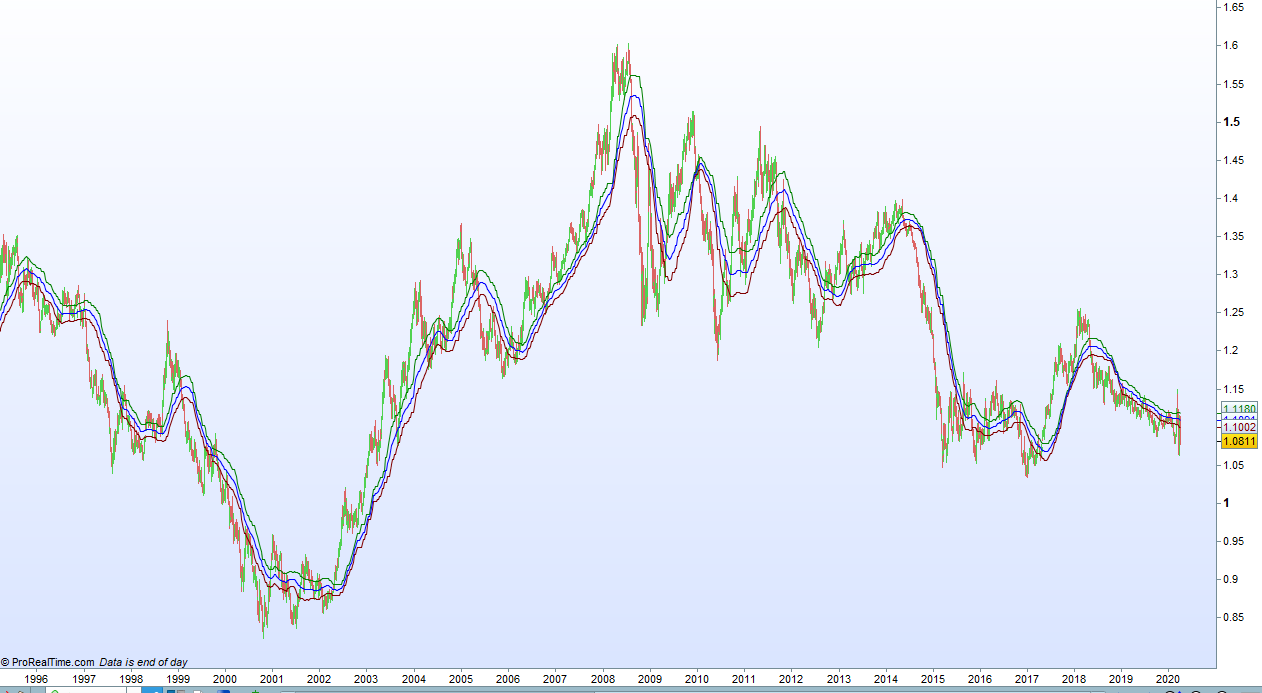
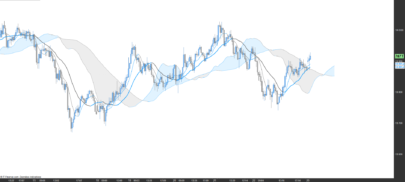
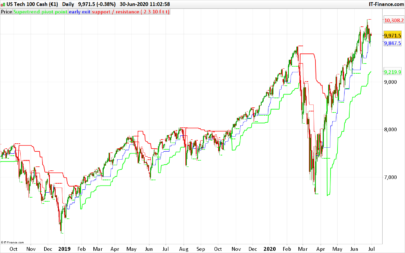
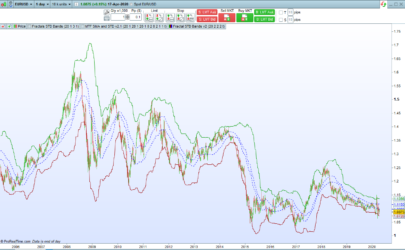
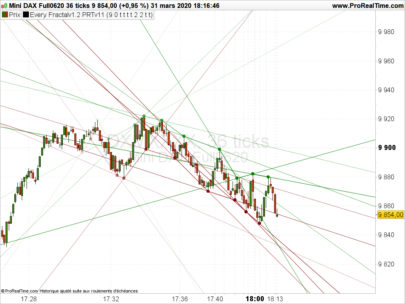
This indicator draws three average lines. The green line is the average value of the last p swing high fractals and the red line is the average value of the last p swing low fractals. The blue line is the mid point between these two averages.
This indicator only works on PRTv11 onwards.
Set the period used for the average calculation by changing the value of p.
The type of fractal used in the calculation can be changed by adjusting the ‘BarsBefore’ and ‘Bars After’ settings. For example if BarsBefore = 2 and BarsAfter = 1 then the swing high fractals would have a high with two bars preceding it with lower highs and one bar after it with a lower high and the swing low fractals would have a low with two bars preceding it with higher lows and one bar after it with a higher low.
The displaying of the three lines can be turned on or off using the ‘HighFracAverage’, ‘LowFracAverage’ and ‘MidAverage’ settings.
As always I advise downloading and importing the ITF file to get full functionality.
|
1 2 3 4 5 6 7 8 9 10 11 12 13 14 15 16 17 18 19 20 21 22 23 24 25 26 27 28 29 30 31 32 33 34 35 36 37 38 39 40 41 42 43 44 45 46 47 48 49 50 51 52 53 54 55 56 57 58 59 60 61 62 63 64 65 66 67 68 |
//Fractals Average //By Vonasi //Date 20200406 p = 50 BarsBefore = 2 BarsAfter = 2 Support = 1 Resistance = 1 once supportavg = undefined once resistanceavg = undefined if barindex >= barsbefore + barsafter then BarsBefore = max(BarsBefore,1) BarsBefore = max(BarsAfter,1) BarLookBack = BarsAfter + 1 if low[BarsAfter] < lowest[BarsBefore](low)[BarLookBack] THEN if low[BarsAfter] = lowest[BarLookBack](low) THEN a = a + 1 $supportvalue[a] = low[barsafter] endif endif if support then supporttotal = 0 if a >= p then for c = a downto a-p+1 supporttotal = supporttotal+$supportvalue[c] next supportavg = supporttotal/p endif endif if high[BarsAfter] > highest[BarsBefore](high)[BarLookBack] THEN if high[BarsAfter] = highest[BarLookBack](high) THEN b = b + 1 $resistancevalue[b] = high[barsafter] endif endif if resistance then resistancetotal = 0 if b >= p then for c = b downto b-p+1 resistancetotal = resistancetotal+$resistancevalue[c] next resistanceavg = resistancetotal/p endif endif endif midavg = ((supportavg + resistanceavg)/2) if not highfracaverage then resistanceavg = undefined endif if not lowfracaverage then supportavg = undefined endif if not midaverage then midavg = undefined endif return supportavg coloured(128,0,0), resistanceavg coloured(0,128,0), midavg coloured(0,0,255) |
Share this
No information on this site is investment advice or a solicitation to buy or sell any financial instrument. Past performance is not indicative of future results. Trading may expose you to risk of loss greater than your deposits and is only suitable for experienced investors who have sufficient financial means to bear such risk.
ProRealTime ITF files and other attachments :PRC is also on YouTube, subscribe to our channel for exclusive content and tutorials

Thank you. Experimenting with it now.
Hi Vonasi. Thank for this indicator. I like this calculate concept.
I think that line 16 this code will be:
BarsAfter = max(BarsAfter,1) and not BarsBefore = max(BarsAfter,1)
Great job.
Well spotted! It is just a safety check to ensure that no value below 1 can be used otherwise the indicator crashes. Everyone should change that line after downloading the indicator.