Channels indicators are widely used in technical analysis, they provide lot of information. In general, technical indicators giving upper/lower extremities are calculated by adding/subtracting a volatility component to a central tendency estimator. This is the case with Bollinger bands, using the rolling standard deviation as volatility estimator and the simple moving average as central tendency estimator, or the Keltner channels using the exponential moving average and the average true range.
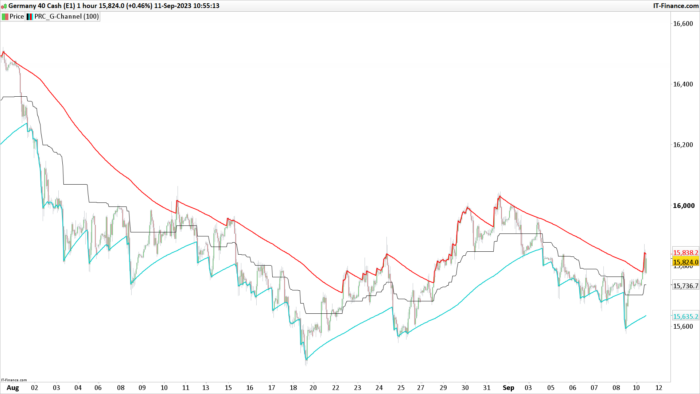
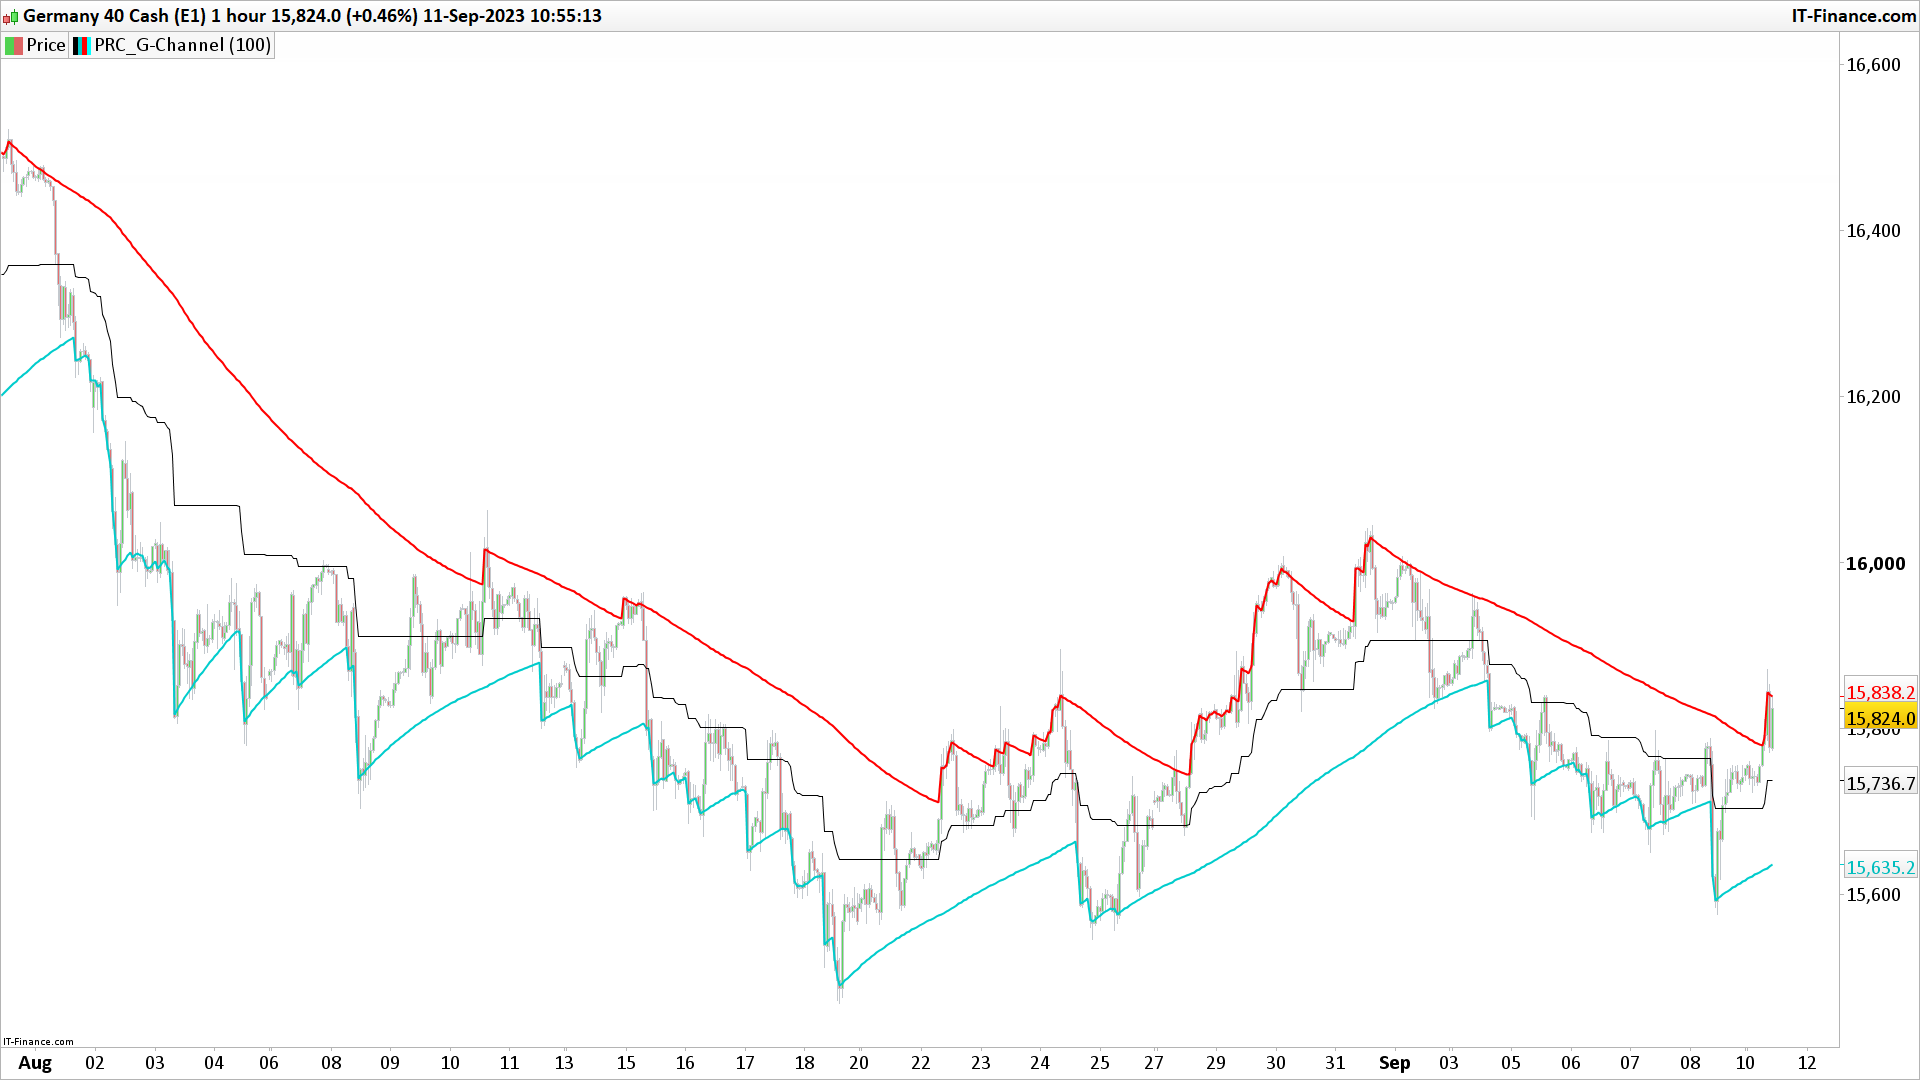
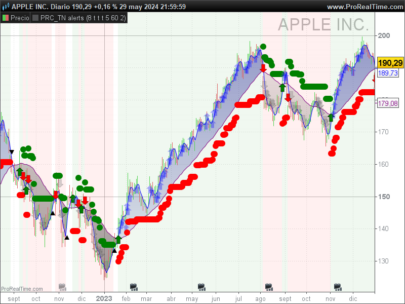
Lots and lots and lots of those indicators have been made, they only really need a central tendency estimator, which can be obtained from pretty much any filter, however i find interesting to focus on the efficiency of those indicators, therefore i propose a super efficient channel indicator using recursion. The average resulting from the upper/lower extremity of the indicator provide a new efficient filter similar to the average highest/lowest.
The calculation – How Does It Works:
Efficiency is often associated to recursion, this would allow us to use past output values as input, so how does the indicator is calculated? Lets look at the upper band calculation :
a = max(src,(a[1])) – (a[1] – b[1])/length
src is the closing price, a is upper extremity, b is the lower one. Here we only need 3 values, the previous values of a and b and the closing price. Basically a = max(src,a[1]) mean :
if the closing price is greater than the precedent value of a then output the closing price, else output the precedent value of a
therefore a will never be inferior to its precedent value, this is useful for getting the maximum price value in our dataset however its not useful to make an upper band, therefore we subtract this to a correction factor defined as the difference between a and b, this force the upper band to have lower values thus acting like a band without loosing its “upper” property, a similar process is done with the lower band.
Of course we could only use 2 values for making the indicator, thus ending with :
a = max(src,a[1]) – (abs(close – a[1])/length
(description from original author: alexgrover)
|
1 2 3 4 5 6 7 8 9 10 11 12 13 14 15 16 17 18 |
//PRC_G-Channel | indicator //11.09.23 //Nicolas @ www.prorealcode.com //Sharing ProRealTime knowledge //original author: alexgrover //--- settings length=30 //--- end of settings once a = high once b = low if barindex>length then a = max(customclose,(a[1])) - (a[1] - b[1])/length b = min(customclose,(b[1])) + (a[1] - b[1])/length avg = (a+b)/2 endif return a,b,avg |
Share this
No information on this site is investment advice or a solicitation to buy or sell any financial instrument. Past performance is not indicative of future results. Trading may expose you to risk of loss greater than your deposits and is only suitable for experienced investors who have sufficient financial means to bear such risk.
ProRealTime ITF files and other attachments :PRC is also on YouTube, subscribe to our channel for exclusive content and tutorials








I really like it when you develop ideas around price movement! I am much less a fan of all the indicators calculated with averages of this or that, too subjective in my opinion!