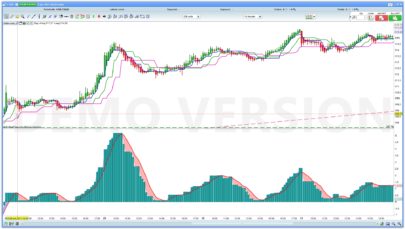
G-Channels – Efficient Calculation Of Upper/Lower Extremities

G-Channels – Efficient Calculation Of Upper/Lower Extremities

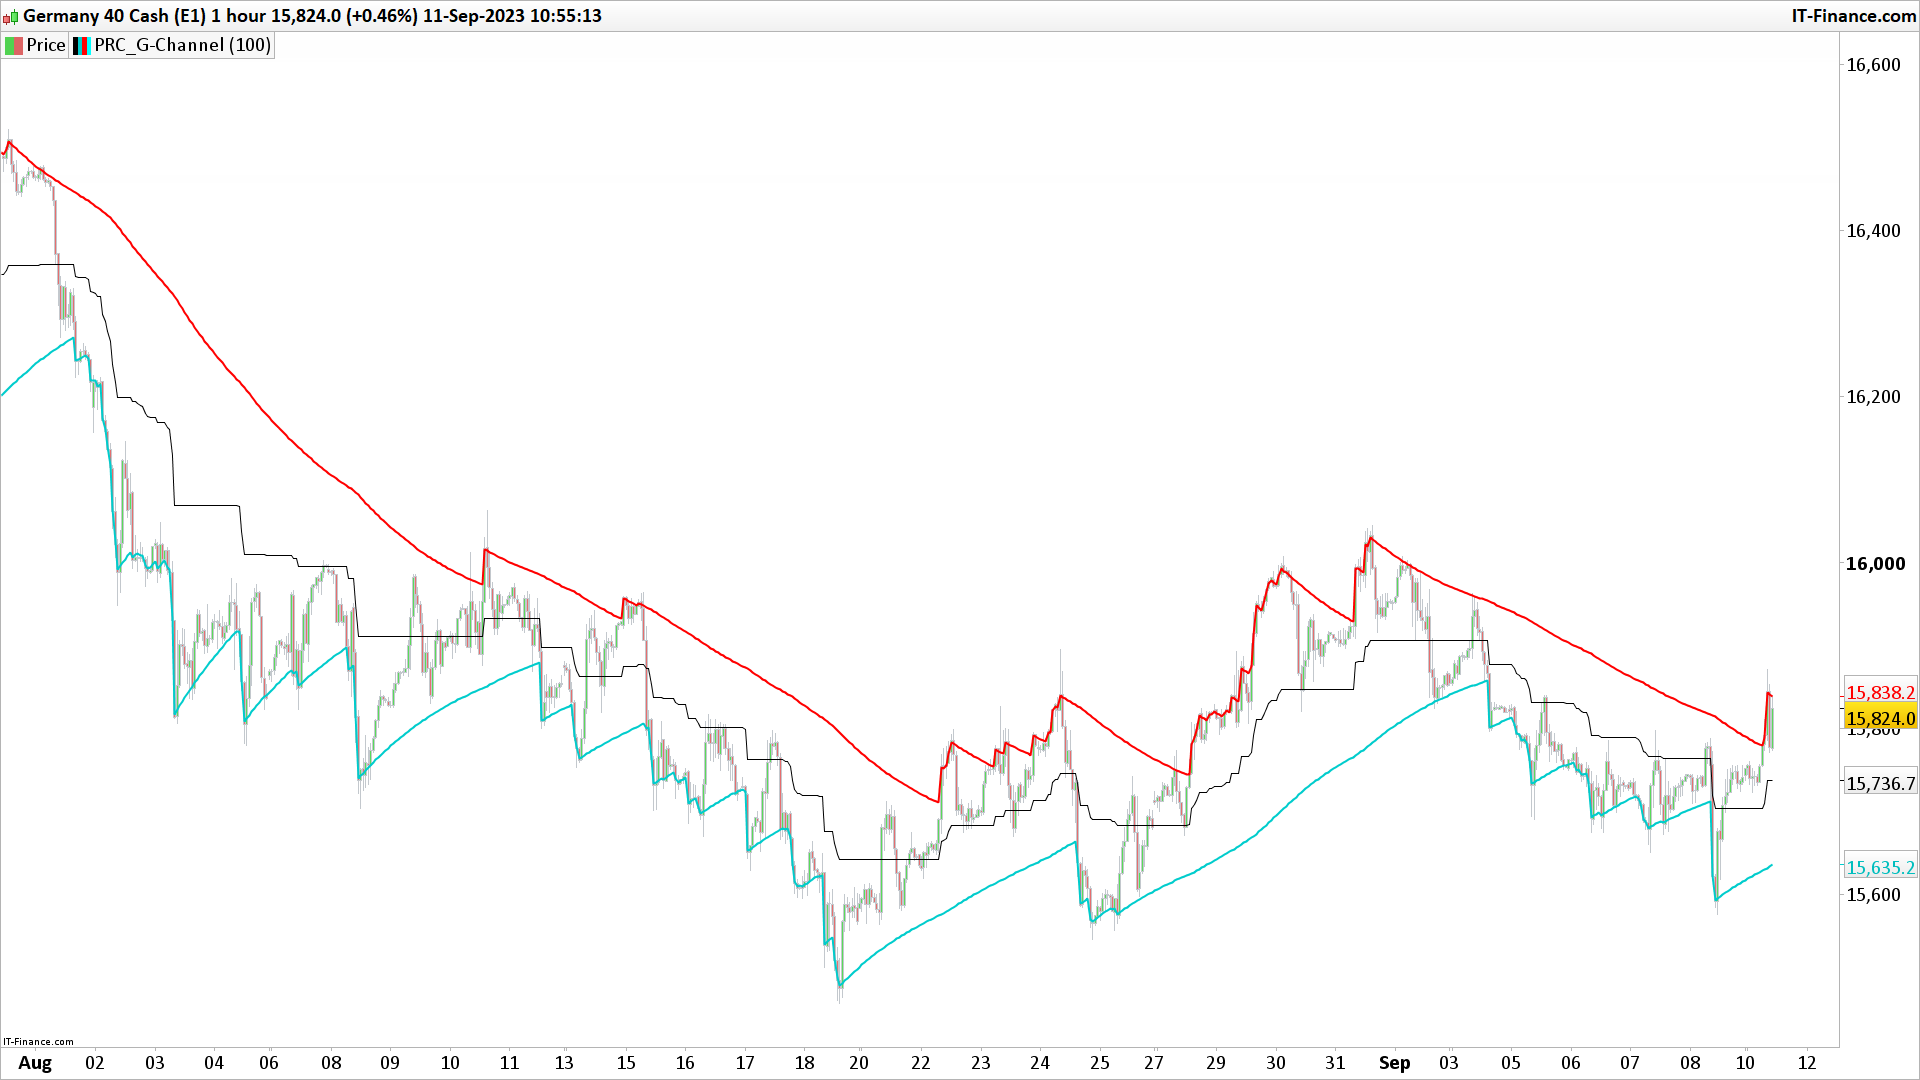
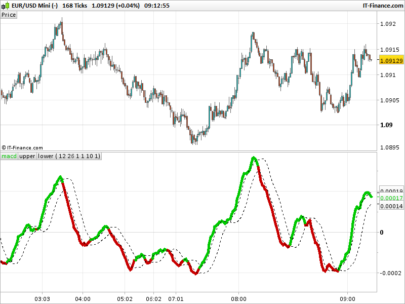
Channels indicators are widely used in technical analysis, they provide lot of information. In general, technical indicators giving upper/lower extremities are calculated by adding/subtracting a volatility component to a central tendency estimator. This is the case with Bollinger bands, using the rolling standard deviation as volatility estimator and the simple moving average as central tendency estimator, or the Keltner channels using the exponential moving average and the average true range.

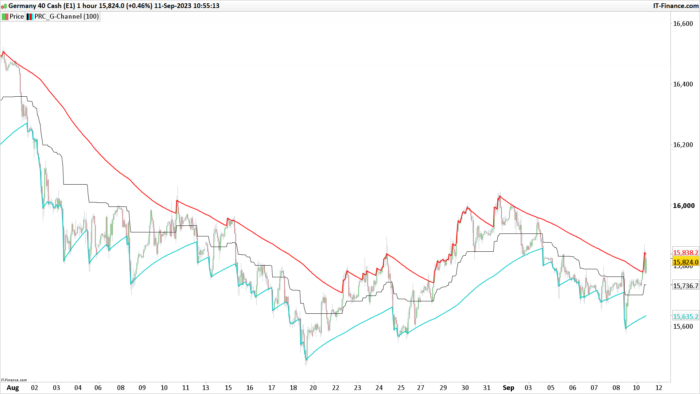
Lots and lots and lots of those indicators have been made, they only really need a central tendency estimator, which can be obtained from pretty much any filter, however i find interesting to focus on the efficiency of those indicators, therefore i propose a super efficient channel indicator using recursion. The average resulting from the upper/lower extremity of the indicator provide a new efficient filter similar to the average highest/lowest.

The calculation – How Does It Works:

Efficiency is often associated to recursion, this would allow us to use past output values as input, so how does the indicator is calculated? Lets look at the upper band calculation :

a = max(src,(a[1])) – (a[1] – b[1])/length

src is the closing price, a is upper extremity, b is the lower one. Here we only need 3 values, the previous values of a and b and the closing price. Basically a = max(src,a[1]) mean :

if the closing price is greater than the precedent value of a then output the closing price, else output the precedent value of a

therefore a will never be inferior to its precedent value, this is useful for getting the maximum price value in our dataset however its not useful to make an upper band, therefore we subtract this to a correction factor defined as the difference between a and b, this force the upper band to have lower values thus acting like a band without loosing its “upper” property, a similar process is done with the lower band.

Of course we could only use 2 values for making the indicator, thus ending with :

a = max(src,a[1]) – (abs(close – a[1])/length

(description from original author: alexgrover)

Share this

Risk disclosure:

No information on this site is investment advice or a solicitation to buy or sell any financial instrument. Past performance is not indicative of future results. Trading may expose you to risk of loss greater than your deposits and is only suitable for experienced investors who have sufficient financial means to bear such risk.

ProRealTime ITF files and other attachments : How to import ITF files into ProRealTime platform?

PRC is also on YouTube, subscribe to our channel for exclusive content and tutorials
  1. Alai-n • 09/11/2023 #

    I really like it when you develop ideas around price movement! I am much less a fan of all the indicators calculated with averages of this or that, too subjective in my opinion!

avatar
Register or

Likes

avatar avatar avatar avatar avatar avatar avatar avatar avatar
Related users ' posts
EchnatonX Hallo Im Demomodus bei IG habe ich das Problem, dass oft keine Orders ausgeführt werden kön...
Jan EchnatonX, nice late answer of me: Make the stop loss a percentage of the close, like 100/...
guleny Hello I made some optimization to make it better. But there are 5 transacttion which incr...
stratobast Good afternoon everyone. Thanks Doctrading for your work. I have an issue while using this ...
stratobast My bad guys. I understood what was the problem. The indicator uses highs and lows for the Re...
samwarduk Has anyone tried this on Bitcoin GBP1? The results look amazing but every time mine trie...
Kris75 Hi Bolsatrilera, I love this indicator! Thanks; => did you develop a strategy around...
Doctrading AH ok, I think the ca3 is the same : ca3 = pB[1] < 0.2 and pB < 0.2 Best regards,
chromosome21 Hello everybody, First, thank you so much for all your advices, I'm a begginer in trading a...
bertrandpinoy bonjour j ai un probleme avec ce code modifié, apparement PRT ne veut pas...avez vous une so...
rispardin no entiendo como funciana este indicador, por favor alguien podria explicar como utilizarlo???
AVT No se trata de un solo indicador, pero cada linea muestra otra información, de abajo hacia ...
IV Mcm Your indicator is interesting, I evaluated its relevance with the squeeze to detect the phas...
Kris75 Hi Gabri I launched a very simple strategy based on the 3 bars trailing stop that you cre...
TimDeCat Hi. Has anyone coded a version that you could alter it to say 5 bar trailing stop? ie make ...
Nicolas Please open a new topic in forums so we can code it there, thanks.
finplus bonjour, il y a un problème à la fin du code avec elsif (close 0 then ... ne manque t il pas...
kj1988 Hello Nicolas, thank you for this useful indicator. Could you tell me how I can remove the...
Nicolas remove lines 101 to 103
GraHal Yes sorry, I set up a link to a screen shot on my google drive and then I got locked into th...
gabri Here's the thread https://www.prorealcode.com/topic/multiframe-rsi-of-rsi/
Bernard13 Bonjour Nicolas, Pourriez-vous m'indiquer si cet indicateur fonctionne avec la V11 ? Le di...
HeikinAshi Do you have an update of this indicator since you've created them, or is this still the actu...
mcha Thank you for this work. Do you try to transform/put this indicator on candlesticks and is ...
diegofe_2000 cordial saludo NICOLAS , gracias por excelente indicador. ¿ es posible obtenerlo en MT4 ? ...
Nicolas Lo siento, pero no estoy trabajando para ayudar a la gente aquí de forma gratuita para promo...
diegofe_2000 Nicolas , gracias por tu atención. La pregunta era por curiosidad (yo no trabajo ni manejo ...
David Balance thanks for sharing this excellent indicator.  Here are some thoughts.  please ad...
reb Hello Marc your strat seems very intersting, will take a look Reb
897148 What exactly is meant by Total price? Is r1 =28 in your example the no of days for "Total P...
otty82  THX looks good!
century nice one , thank you
arvindrao01 Hey! Does anyone have a pinescript (tradingview) code for this?
imokdesign Hi Everybody, when I look at the strategy I felt the need to implement a Moneymanagement-Sy...
Inertia newlevel then multiplier=multiplier+1 oldlevel=newlevel newlevel=strategyprofit+startequi...
Inertia Hi Bjoern, I was playing around with your code this morning (EUR/USD 5'). Thank you to the...
CavalierDeCesDames Bonjour Nicolas, Thanks for your use full job. I tried this indicator on a shorter timefram...
Nicolas You are welcome. I'm glad you like it.
Bolbo It does not appear over the price indicator on V11. Thanks in advance.
bearbull As per PhilipSchultz question above, has anybody managed to add code for when it turns blue,...
Ybr35 Bonjour Nicolas, lorsque je lance l'indicateur, il m'est indiqué que je dois définir les var...
Nicolas L'idéal est de télécharger le fichier itf joint sur cette page et de l'importer dans la plat...
albertocampagna Sei grande Nicolas :-)
SAcht Dear Nicolas, Great work, thank you very much!I would love to use the indicator in ProScree...
SAcht btw: The above-posted ProScreener is supposed to show stocks for which the center line has i...
Nicolas Merci dans ce cas d'ouvrir un sujet dans le forum ProScreener svp.
Andrea Hi Nicolas, thx for your code. Please i need your help to understand this part of your code:...
Nicolas the MA200 is ascending since 20 periods.
Regan2020 Hi, has anybody update the above code to enable on a 15m or 5m TF?
gigi64 ik heb de code op mijn pro realtime gezet , en bij indicator staat hij erbij maar komt niet ...
gigi64 I have put the code on my pro realtime, and it is on the indicator, but it does not appear o...
supertiti Thanks you so much Lucassen
dreif123 hi, copied the above code, not working on 10.3 the system says "return can only be used at ...
LUCASSEN Hallo , i have no problem , and i have the same versie 10.3, maybe you can ask Nicolas, tha...

Top