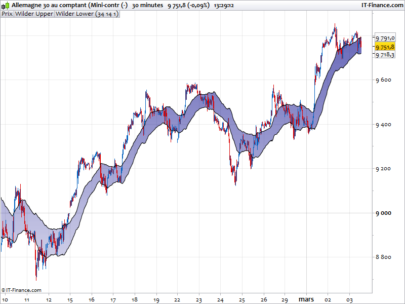
G-Channels – Efficient Calculation Of Upper/Lower Extremities

G-Channels – Efficient Calculation Of Upper/Lower Extremities

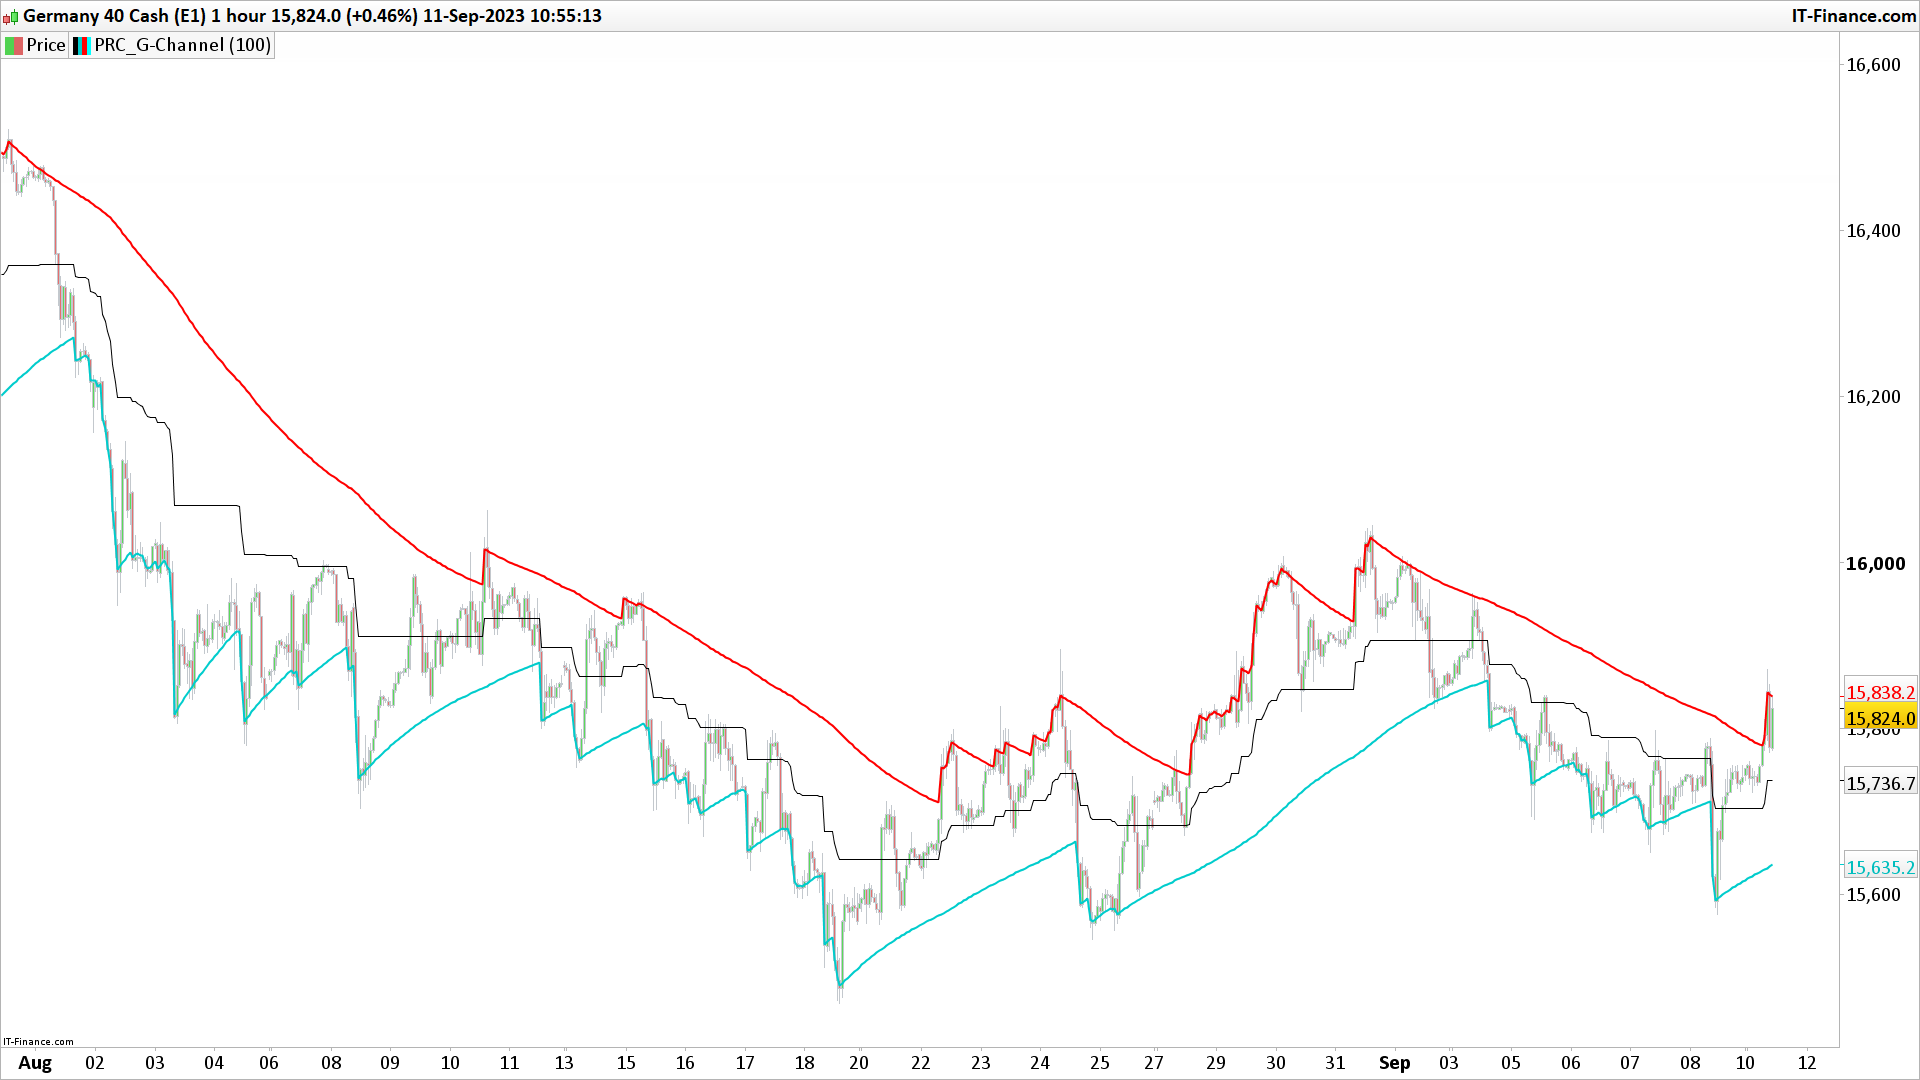
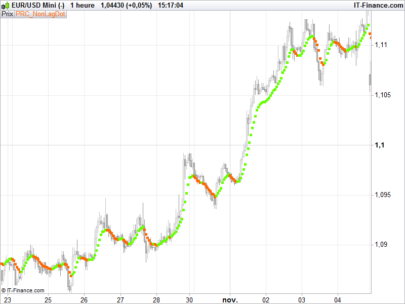
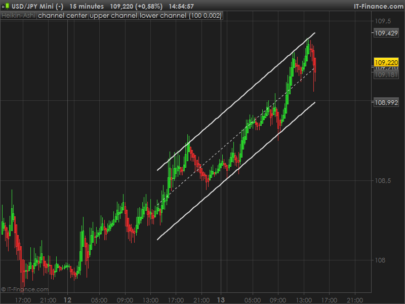
Channels indicators are widely used in technical analysis, they provide lot of information. In general, technical indicators giving upper/lower extremities are calculated by adding/subtracting a volatility component to a central tendency estimator. This is the case with Bollinger bands, using the rolling standard deviation as volatility estimator and the simple moving average as central tendency estimator, or the Keltner channels using the exponential moving average and the average true range.

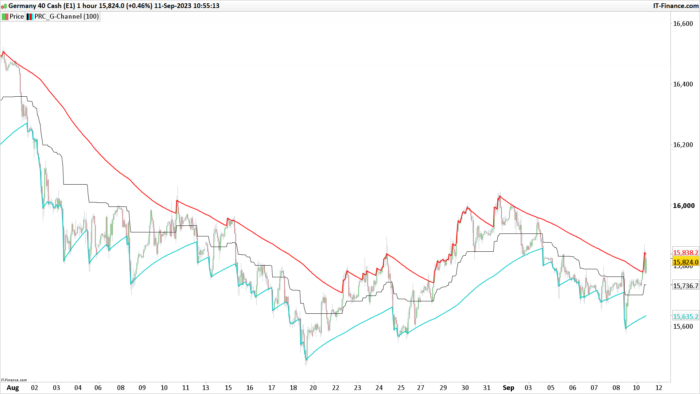
Lots and lots and lots of those indicators have been made, they only really need a central tendency estimator, which can be obtained from pretty much any filter, however i find interesting to focus on the efficiency of those indicators, therefore i propose a super efficient channel indicator using recursion. The average resulting from the upper/lower extremity of the indicator provide a new efficient filter similar to the average highest/lowest.

The calculation – How Does It Works:

Efficiency is often associated to recursion, this would allow us to use past output values as input, so how does the indicator is calculated? Lets look at the upper band calculation :

a = max(src,(a[1])) – (a[1] – b[1])/length

src is the closing price, a is upper extremity, b is the lower one. Here we only need 3 values, the previous values of a and b and the closing price. Basically a = max(src,a[1]) mean :

if the closing price is greater than the precedent value of a then output the closing price, else output the precedent value of a

therefore a will never be inferior to its precedent value, this is useful for getting the maximum price value in our dataset however its not useful to make an upper band, therefore we subtract this to a correction factor defined as the difference between a and b, this force the upper band to have lower values thus acting like a band without loosing its “upper” property, a similar process is done with the lower band.

Of course we could only use 2 values for making the indicator, thus ending with :

a = max(src,a[1]) – (abs(close – a[1])/length

(description from original author: alexgrover)

Share this

Risk disclosure:

No information on this site is investment advice or a solicitation to buy or sell any financial instrument. Past performance is not indicative of future results. Trading may expose you to risk of loss greater than your deposits and is only suitable for experienced investors who have sufficient financial means to bear such risk.

ProRealTime ITF files and other attachments : How to import ITF files into ProRealTime platform?

PRC is also on YouTube, subscribe to our channel for exclusive content and tutorials
  1. Alai-n • 09/11/2023 #

    I really like it when you develop ideas around price movement! I am much less a fan of all the indicators calculated with averages of this or that, too subjective in my opinion!

avatar
Register or

Likes

avatar avatar avatar avatar avatar avatar avatar avatar avatar
Related users ' posts
Krallenmann Hallo Nicolas, kannst du mir die Regeln für den Halftrend Indikator sagen? Aus dem Code kann...
davefransman Dear Nicolas, i want set a alert on the "HalfTrend "custom moving average" met Heikin Ashi w...
Nicolas Please post the question in a new forum topic, that would need custom coding I believe.
Lyam Pareil ne marche pas dommage
ahmedbouaziz89 Bonjour, quand j'ajoute le code ou le fichier dans l'outils screeners de Prorealtime je ne v...
tyvix Bonjour le code marche bien c est juste qu'il n y a pas d opportunité au moment ou vous le...
verdi55 Is there such a thing as a free lunch ?
maceng Thanks Nicolas for this great work! I would like to understand the math behind it in order t...
Nicolas Sorry I have no time to provide assistance for python programmers. Have a good day.
Maz Hi all, firstly happy to know that this is helping you. I look into updating it for PRT11 wh...
Nicolas just use 3 times a linear regression channel code you will find in the library.
leederbyshire Here's the link to alternative linear regression channel indicator Nicolas is referring to t...
Wing Yes, investigate as much as you want. For more insight, you can view the linet1, linet2 etc....
CKW Hi Wing, Thanks for your sharing. I am still trying to breakdown & understand your code...
Wing Hello CKW. No, the parameter, 7 in this case, is used when calling the RSI indicator to ide...
Nicolas Je vais faire l'indicateur et expliquer comment en même temps dans un sujet de forum. Plus s...
gregus merci nicolas toute ma gratitude est pour toi sa sera bien pratique car je pense ne pas etre...
Nicolas Ok merci donc d'ouvrir un sujet spécifique pour cette demande donc :) 
algotrader This indicator looks coolBut on attempt to use it for a strategy dev'I get an error.."The in...
dajvop @algotrader if you at the bottom of the code add: RETURN Buffer1 as "up", Buffer2 as "down",...
Bateson Si cela peut servir, l'indicateur Sadukey a été créé en utilisant un générateur de filtre ap...
Nicolas
9 years ago
ALMA MACD
ALMA MACD
7
Indicators
Arnaud HALVICK Great indicator, thank you!
JMat45 Hi Nicolas, just reviewing this indicator and noticed that you have double assigned the vari...
Nicolas That would not make any difference because the code is read from top to bottom.
MikeGC I don't know if you have used the variables a and b to optimise the parameters for the Super...
gianpiero75 I have not optimized, I multiplied the parameters for 6 (5,8), to use them on the 4  hoursTF...
bertrandpinoy bonjour Mike j utilise TrendChaser V2.0 et quand il prend position cela ne programme pas le ...
eisi If i switch between different Markets, the Backgroundcolour will appear where it should not...
datageek How can I get alerts on colour change?
NAMBO40 Hello, I would like to add a 25 period SMA moving average. It's possible?
Fabio Anthony Terrenzio this strategy works only in a well defined trend
brosly Good afternoon I am trying to get the complete code of lex strategy made by adolfo since I s...
dreif123 hi Adolfo, is Alex Auto Trading Botindex working on DAX as well ? if so , can you post the...
Doctrading I forgot to write at the beginning :  a = 50 b = 50 These are intermediate levels Sorry
DerPat Thank you. This one could be an aid in my current research on stochastics.
Pelayo it is possible that in line 12 we should put seuilinf=-b, thaks for all
Doctrading Hello, Someone asked me something (his results seemed to be different) on my email, but it ...
Glen Marquis Not your best..So what is your best strategy? :)
mamio Very nice indicator. Why doesn't it refresh as time passes?
Nicolas It should refresh on each bar.
mamio On my PC it doesn't refresh. I am using intraday tick bars (not minutes). Unfortunately I do...
Nicolas I would not recommend using this version of the linear regression channel, but this one inst...
Aragorna Hello, Is it possible to updated the indicator to the more updated versione of ProrealTime? ...
Nicolas Use that code instead: https://www.prorealcode.com/prorealtime-indicators/standard-deviation...
Nicolas You can try this code for buy and hold curve line: capital = 10000 mylot = 2 i1 = capi...
soukenson Bonjour Nicolas, Je ne comprends pas où ajouter le code que tu as a donné dans le code initi...
Nicolas Tu veux parler du code pour comparer avec le "buy and hold" ? Si oui, tu as tout ce qu'il fa...
GraHal Hi Nicolas I like this and would like to understand it fully so please forgive the (maybe) d...
Nicolas Hi GraHal, the Factor parameter is only a multiplier of the ATR that is added or subtracted ...
GraHal Nicolas, thank you for your useful and informative response. Yes I optimise using ProBackte...
Denis Hello, Congratulations and thank you for this work. I do not understand one thing, however...
Nicolas
9 years ago
GraHal Hi Nicolas Britains .itf file didn't work for me ... I had to change h to hh at line 13 and...
Nicolas Thank you GraHal for pointing this error, i have corrected the code in the file. The code in...
Nicolas
9 years ago

Top