




More from ProRealCode
ProRealCode - Trading & Coding with ProRealTime™
The ProRealTime™ community on the web! Officially sharing ProRealTime knowledge to Worldwide users since 2015!



Gann Market Model
June 25, 2018, 9:02 AM
Indicators
0 Comments
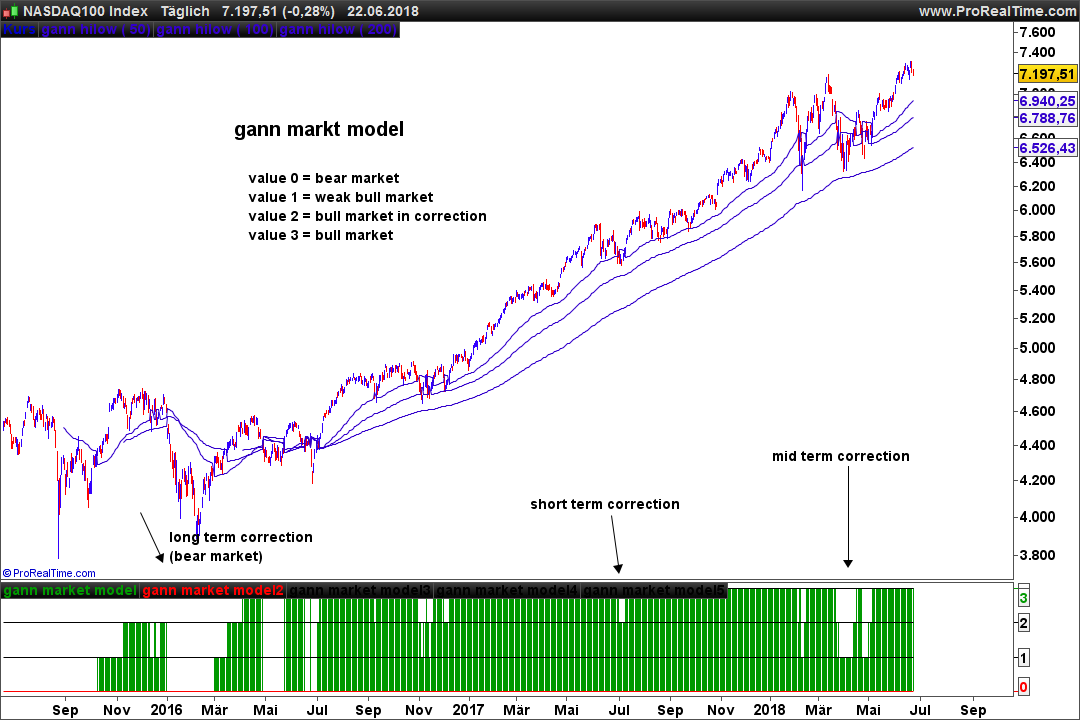
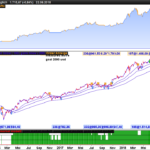
This Indicator designed by Marcus Schöppl shows the different market conditions by 50, 100 and 200 days. this are the most important parameters in investing.
The value of 3 ist the top score in a bull market without correction and so on.
//short term
a1= ExponentialAverage[50](high)[1]
b1=ExponentialAverage[50](low)[1]
if customclose > a1 then
 c1 = 1
 Else
 IF customclose < b1 then
  c1=-1
 endif
ENDIF
if c1= -1  then
 D1 = a1

ELSE
 D1=b1

endif

a2= ExponentialAverage[100](high)[1]
b2=ExponentialAverage[100](low)[1]
if customclose > a2 then
 c2 = 1
 Else
 IF customclose < b2 then
  c2=-1
 endif
ENDIF
if c2= -1  then
 D2 = a2

ELSE
D2=b2

endif

a3= ExponentialAverage[200](high)[1]
b3=ExponentialAverage[200](low)[1]
if customclose > a3 then
 c3 = 1
 Else
 IF customclose < b3 then
  c3=-1
 endif
ENDIF
if c3= -1  then
 D3 = a3

ELSE
 D3=b3

endif

if D1 < close then
 result = 1
else
 result = 0
endif

if D2 < close then
 result1 = 1
else
 result1 = 0
endif

if D3 < close then
 result2 = 1
else
 result2 = 0
endif

c10 = (result+result1+result2)

return c10,0,1,2,3
Download
Filename:
Gann-Market-Model.itf
Downloads:
381
Veteran
secundary school-education to banker staff-multiple host part time - economist partime like: reading-thinking biases and chess.
Author’s Profile
Similar code
Genesis Matrix TradingIndicators
Angle Market Structure — Swing LevelsIndicators
Market Structure AlgoIndicators
Market Structure Trend MatrixIndicators
Loading...