
Introduction
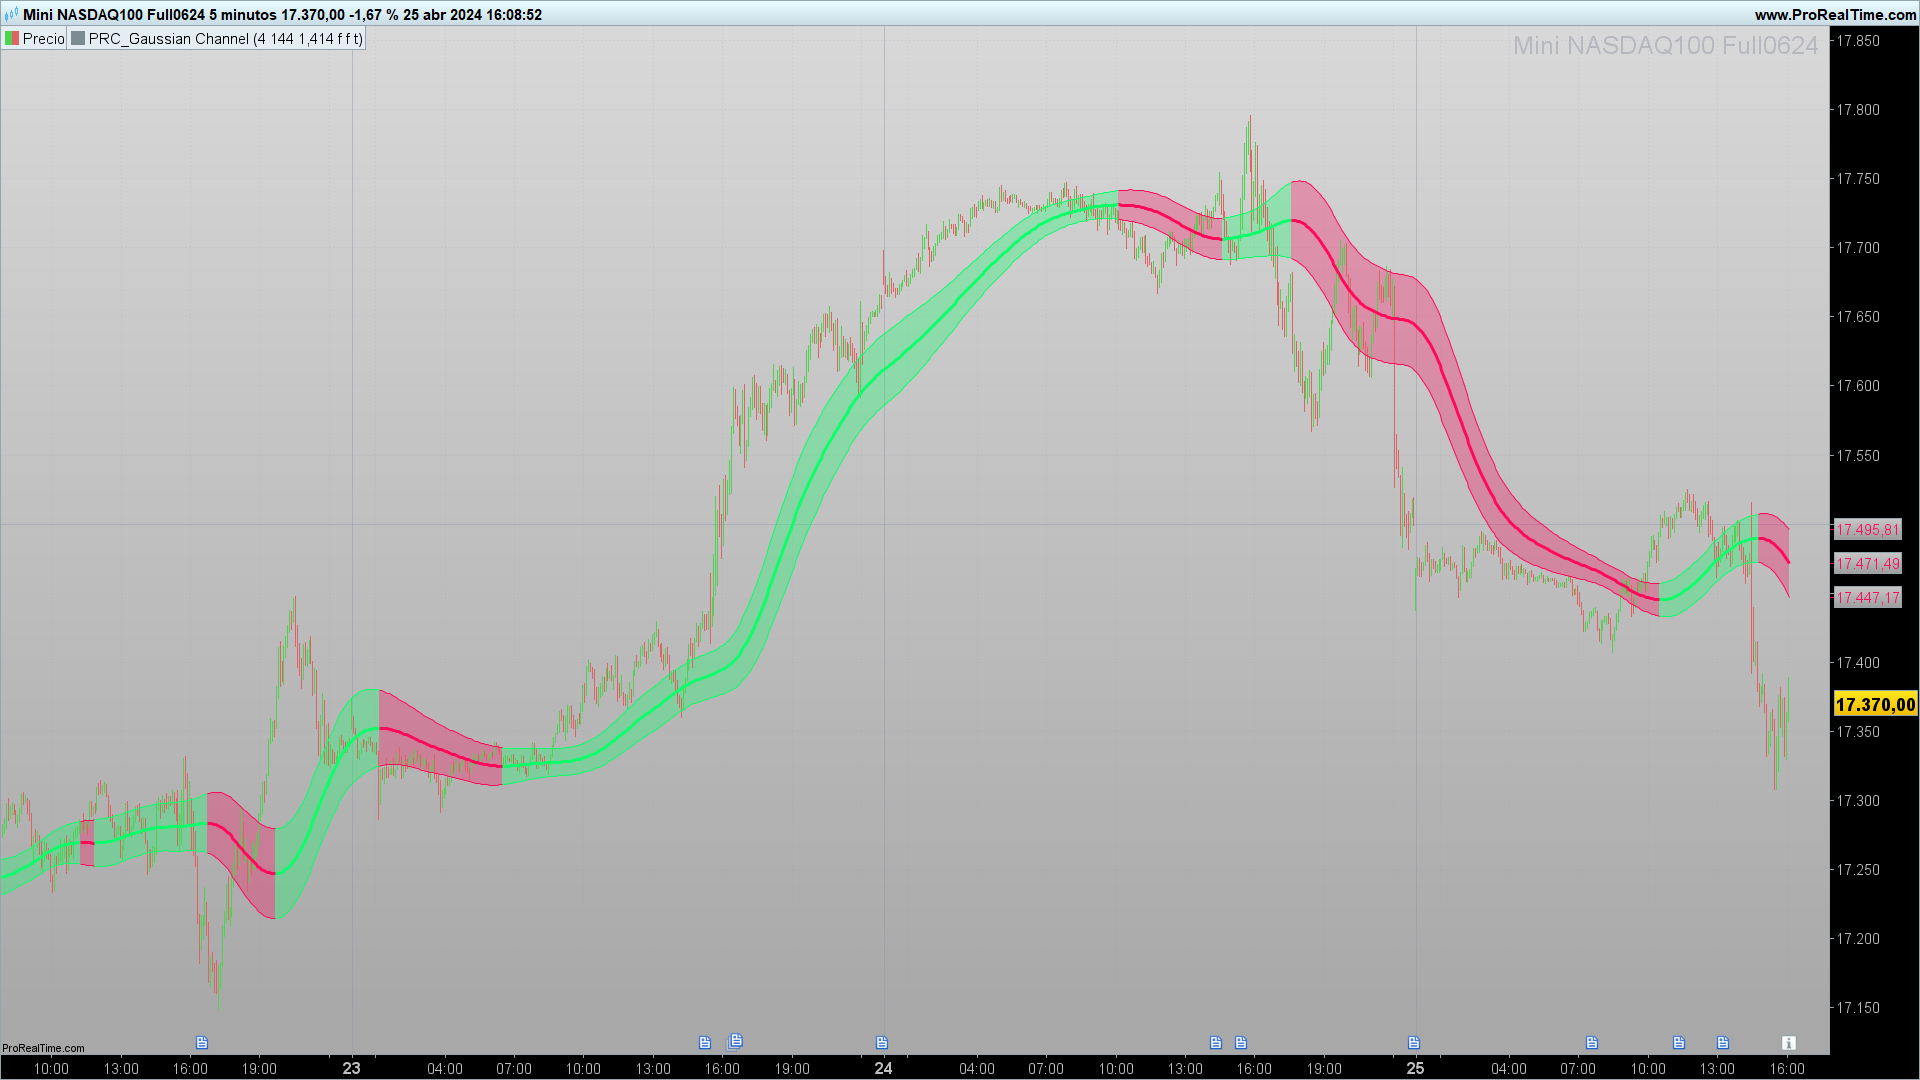
The Gaussian Channel is an advanced technical indicator that uses statistical principles to determine the upper and lower limits of an asset’s price movements. This indicator is especially valuable for identifying the overall market trend and potential reversal points through the analysis of standard deviations of a moving average.
Theory Behind the Gaussian Channel
The Gaussian Channel is an indicator based on the analysis of the normal distribution of prices around an adaptive moving average. This analysis is based on statistical theory that posits that asset prices, like many other variables in nature and society, tend to follow a normal or Gaussian distribution under certain conditions.
Mathematical Foundation:
The core of the Gaussian Channel indicator is based on the equation of the Gaussian curve, where the mean of the data set (prices in this context) forms the central peak of the curve, and the standard deviations determine the dispersion or “width” of the curve around this mean.
Adaptive Moving Average:
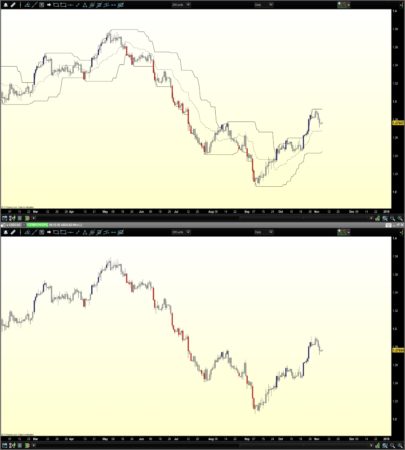
Calculated as a weighted average of prices over a given period, which adjusts each bar to more significantly reflect the most recent data than the previous ones. This is achieved using coefficients that decay exponentially.
Calculation of Bands:
Upper and Lower Bands: Determined by adding and subtracting, respectively, a multiple of the standard deviation from the calculated adaptive moving average. The standard deviation is a statistical measure that quantifies the variation or dispersion of a set of values.
Standard Deviation Multiplier: This multiplier, often set at 2 for many statistically based channel applications, defines the width of the channel. A multiplier of 2 ensures that approximately 95% of all prices should fall within the channel under a normal distribution.
Significance in Trading:
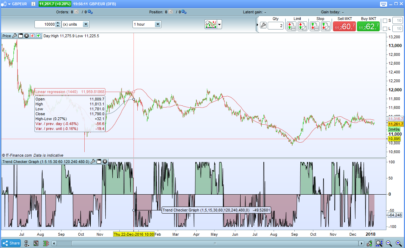
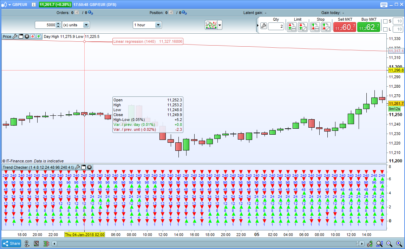
Trading with the Trend: When the price consistently stays near the upper band, it suggests a strong bullish trend, whereas a price close to the lower band indicates a bearish trend.
Volatility Identification: A widening of the channel reflects an increase in market volatility, while a narrower channel suggests a decrease in volatility.
Thus, the Gaussian Channel not only helps visualize trend and volatility but also provides potential entry and exit points based on the statistic that prices will return to their mean with certain regularity.
Practical Applications
This indicator is useful for traders looking to confirm the current trend or identify potential overbought or oversold conditions in the market. For instance, a price that consistently moves near the upper limit of the channel could indicate a strong bullish trend, while a price approaching the lower limit may suggest a bearish trend.
Indicator Configuration
The Gaussian Channel indicator in ProRealTime allows for adjusting several parameters:
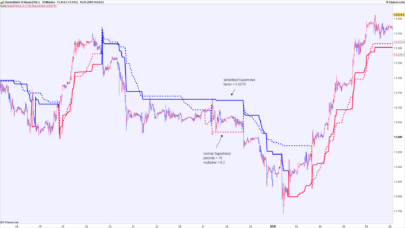
N (Number of Poles): Determines the smoothness of the moving average.
per (Sampling Period): Defines the time window for calculating the average and deviations.
mult (True Range Multiplier): Adjusts the amplitude of the bands around the moving average.
These parameters can be calibrated to suit different trading styles and assets, depending on the nature of price movements and the volatility of the instrument in question.
Implementation in ProRealTime
The code for the Gaussian Channel is developed in ProRealTime’s ProBuilder language, facilitating direct integration into the trading platform.
The complete code is designed to be copied and pasted directly into ProRealTime for immediate use.
If you prefer the code with the configurable variables already set up, you can download the .itf file attached to this post.
|
1 2 3 4 5 6 7 8 9 10 11 12 13 14 15 16 17 18 19 20 21 22 23 24 25 26 27 28 29 30 31 32 33 34 35 36 37 38 39 40 41 42 43 44 45 46 47 48 49 50 51 52 53 54 55 56 57 58 59 60 61 62 63 64 65 66 67 68 69 70 71 72 73 74 75 76 77 78 79 80 81 82 83 84 85 86 87 88 89 90 91 92 93 94 95 96 97 98 99 100 101 102 103 104 105 106 107 108 109 110 111 112 113 114 115 116 117 118 119 120 121 122 123 124 125 126 127 128 129 130 131 132 133 134 135 136 137 138 139 140 141 142 143 144 145 146 147 148 149 150 151 152 153 154 155 156 157 158 159 160 161 162 163 164 165 166 167 168 169 170 171 172 173 174 175 176 177 178 179 180 181 182 183 184 185 186 187 188 189 190 191 192 193 194 195 196 197 198 199 200 201 202 203 204 205 206 207 208 209 210 211 212 213 214 215 216 217 218 219 220 221 222 223 224 225 226 227 228 229 230 231 232 233 234 235 236 237 238 239 240 241 242 243 244 245 246 247 248 249 250 251 252 253 254 255 256 257 258 259 260 |
//-----------------------------------------------------------// //PRC_Gaussian Channel //version = 0 //19.04.24 //Iván González @ www.prorealcode.com //Sharing ProRealTime knowledge //-----------------------------------------------------------// //-----Inputs------------------------------------------------// source=(high+low+close)/3 N=4//Poles per=144//Sampling period mult=1.414//True Range multiplier modelag=0//Boolean//Reduced Lag Mode colorcandle=0//Boolean//Color Candles colorchannel=1//Boolean//Color Channel //-----------------------------------------------------------// //-----Beta and Alpha components-----------------------------// beta = (1-cos(4*asin(1)/per))/(pow(1.414,2/N)-1) alpha = - beta + SQRT(pow(beta,2) + 2*beta) lag = round((per-1)/(2*N)) //-----------------------------------------------------------// //-----Data--------------------------------------------------// if modelag then if barindex <= lag then src=source trdate=tr else src=source+(source-source[lag]) trdata=tr+(tr-tr[lag]) endif else src=source trdata=tr endif //-----------------------------------------------------------// //-----Filtered Values---------------------------------------// x=1-alpha if N=9 then m2=36 m3=84 m4=126 m5=126 m6=84 m7=36 m8=9 m9=1 elsif N=8 then m2=28 m3=56 m4=70 m5=56 m6=28 m7=8 m8=1 m9=0 elsif N=7 then m2=21 m3=35 m4=35 m5=21 m6=7 m7=1 m8=0 m9=0 elsif N=6 then m2=15 m3=20 m4=15 m5=6 m6=1 m7=0 m8=0 m9=0 elsif N=5 then m2=10 m3=10 m4=5 m5=1 m6=0 m7=0 m8=0 m9=0 elsif N=4 then m2=6 m3=4 m4=1 m5=0 m6=0 m7=0 m8=0 m9=0 elsif N=3 then m2=3 m3=1 m4=0 m5=0 m6=0 m7=0 m8=0 m9=0 elsif N=2 then m2=1 m3=0 m4=0 m5=0 m6=0 m7=0 m8=0 m9=0 endif if barindex <=N then f1=0 f2=0 f3=0 f4=0 f5=0 f6=0 f7=0 f8=0 f9=0 filtN=0 filttrN=0 else if N=9 then f9= pow(alpha,N) * src+N*x*f9[1] - m2*pow(x,2)*f9[2] + m3*pow(x,3)*f9[3] - m4*pow(x,4)*f9[4] + m5*pow(x,5)*f9[5] - m6*pow(x,6)*f9[6] + m7*pow(x,7)*f9[7] - m8*pow(x,8)*f9[8] + m9*pow(x,9)*f9[9] filtN=f9 ftr9= pow(alpha,N) * trdata+N*x*ftr9[1] - m2*pow(x,2)*ftr9[2] + m3*pow(x,3)*ftr9[3] - m4*pow(x,4)*ftr9[4] + m5*pow(x,5)*ftr9[5] - m6*pow(x,6)*ftr9[6] + m7*pow(x,7)*ftr9[7] - m8*pow(x,8)*ftr9[8] + m9*pow(x,9)*ftr9[9] filttrN=ftr9 elsif N=8 then f8= pow(alpha,N) * src+N*x*f8[1] - m2*pow(x,2)*f8[2] + m3*pow(x,3)*f8[3] - m4*pow(x,4)*f8[4] + m5*pow(x,5)*f8[5] - m6*pow(x,6)*f8[6] + m7*pow(x,7)*f8[7] - m8*pow(x,8)*f8[8] filtN=f8 ftr8= pow(alpha,N) * trdata+N*x*ftr8[1] - m2*pow(x,2)*ftr8[2] + m3*pow(x,3)*ftr8[3] - m4*pow(x,4)*ftr8[4] + m5*pow(x,5)*ftr8[5] - m6*pow(x,6)*ftr8[6] + m7*pow(x,7)*ftr8[7] - m8*pow(x,8)*ftr8[8] filttrN=ftr8 elsif N=7 then f7= pow(alpha,N) * src+N*x*f7[1] - m2*pow(x,2)*f7[2] + m3*pow(x,3)*f7[3] - m4*pow(x,4)*f7[4] + m5*pow(x,5)*f7[5] - m6*pow(x,6)*f7[6] + m7*pow(x,7)*f7[7] filtN=f7 ftr7= pow(alpha,N) * trdata+N*x*ftr7[1] - m2*pow(x,2)*ftr7[2] + m3*pow(x,3)*ftr7[3] - m4*pow(x,4)*ftr7[4] + m5*pow(x,5)*ftr7[5] - m6*pow(x,6)*ftr7[6] + m7*pow(x,7)*ftr7[7] filttrN=ftr7 elsif N=6 then f6= pow(alpha,N) * src+N*x*f6[1] - m2*pow(x,2)*f6[2] + m3*pow(x,3)*f6[3] - m4*pow(x,4)*f6[4] + m5*pow(x,5)*f6[5] - m6*pow(x,6)*f6[6] filtN=f6 ftr6= pow(alpha,N) * trdata+N*x*ftr6[1] - m2*pow(x,2)*ftr6[2] + m3*pow(x,3)*ftr6[3] - m4*pow(x,4)*ftr6[4] + m5*pow(x,5)*ftr6[5] - m6*pow(x,6)*ftr6[6] filttrN=ftr6 elsif N=5 then f5= pow(alpha,N) * src+N*x*f5[1] - m2*pow(x,2)*f5[2] + m3*pow(x,3)*f5[3] - m4*pow(x,4)*f5[4] + m5*pow(x,5)*f5[5] filtN=f5 ftr5= pow(alpha,N) * trdata+N*x*ftr5[1] - m2*pow(x,2)*ftr5[2] + m3*pow(x,3)*ftr5[3] - m4*pow(x,4)*ftr5[4] + m5*pow(x,5)*ftr5[5] filttrN=ftr5 elsif N=4 then f4= pow(alpha,N) * src+N*x*f4[1] - m2*pow(x,2)*f4[2] + m3*pow(x,3)*f4[3] - m4*pow(x,4)*f4[4] filtN=f4 ftr4= pow(alpha,N) * trdata+N*x*ftr4[1] - m2*pow(x,2)*ftr4[2] + m3*pow(x,3)*ftr4[3] - m4*pow(x,4)*ftr4[4] filttrN=ftr4 elsif N=3 then f3= pow(alpha,N) * src+N*x*f3[1] - m2*pow(x,2)*f3[2] + m3*pow(x,3)*f3[3] filtN=f3 ftr3= pow(alpha,N) * trdata+N*x*ftr3[1] - m2*pow(x,2)*ftr3[2] + m3*pow(x,3)*ftr3[3] filttrN=ftr3 elsif N=2 then f2= pow(alpha,N) * src+N*x*f2[1] - m2*pow(x,2)*f2[2] filtN=f2 ftr2= pow(alpha,N) * trdata+N*x*ftr2[1] - m2*pow(x,2)*ftr2[2] filttrN=ftr2 elsif N=1 then f1= pow(alpha,N) * src+N*x*f1[1] filtN=f1 ftr1= pow(alpha,N) * trdata+N*x*ftr1[1] filttrN=ftr1 endif endif filt=filtN filtTR=filttrN //-----------------------------------------------------------// //-----Bands-------------------------------------------------// hband=filt+filtTR*mult lband=filt-filtTR*mult //-----------------------------------------------------------// //-----Bands Colors------------------------------------------// if filt > filt[1] then r=10 g=255 b=104 elsif filt<filt[1] then r=255 g=10 b=90 else r=204 g=204 b=204 endif //-----------------------------------------------------------// //-----Candle Colors-----------------------------------------// if colorcandle then if source > source[1] and source>filt and source < hband then rb=10 gb=255 bb=104 elsif source > source[1] and source >= hband then rb=10 gb=255 bb=27 elsif source <= source[1] and source > filt then rb=0 gb=117 bb=45 elsif source < source[1] and source < filt and source > lband then rb=255 gb=10 bb=90 elsif source < source[1] and source <= lband then rb=255 gb=10 bb=17 elsif source >= source[1] and source < filt then rb=153 gb=0 bb=50 else rb=204 gb=204 bb=204 endif DRAWCANDLE(open, high, low, close) coloured(rb,gb,bb) endif //-----------------------------------------------------------// //-----Channel fill color------------------------------------// if colorchannel then colorbetween(hband,lband,r,g,b,80) endif //-----------------------------------------------------------// return hband as "Filtered TR High Band"coloured(r,g,b), lband as "Filtered TR Low Band"coloured(r,g,b),filt as "Filter"coloured(r,g,b)style(line,3) |
Conclusion
The Gaussian Channel indicator offers a robust and mathematically grounded perspective for analyzing financial markets, suitable for both novice traders and experienced technical analysts. Its ability to adapt to market volatility makes it indispensable in any technical trading toolkit.
Share this
No information on this site is investment advice or a solicitation to buy or sell any financial instrument. Past performance is not indicative of future results. Trading may expose you to risk of loss greater than your deposits and is only suitable for experienced investors who have sufficient financial means to bear such risk.
ProRealTime ITF files and other attachments :
Find other exclusive trading pro-tools on ![]()
PRC is also on YouTube, subscribe to our channel for exclusive content and tutorials


Bonsoir, cet indicateur est vraiment très bien avec plusieurs possibilités en coloration .
Cependant je voudrai pouvoir le mettre 2 fois sur un même graphique en renko mais avec la possibilité pour la seconde version d’avoir un multiple de 10.( le meme x10)
J’ai beau essayé de changer les variables je n’y parviens pas.
Est ce Possible et si oui pouvez vous me dire ce qu’il faut modifier dans le code pour y parvenir?
D’avance merci
cdlt
Kats
Thank you Ivan for your indicators, very very interesting!!!!
Bonsoir,
Pensez vous pouvoir répondre à ma question posée ci dessus?
Ce serait vraiment très sympa de votre part car je n’ai pas de grosses compétences en programmation alors je bidouille mais là je coince.
En fait comme je bosse en renko je suis coincé et ne peux pas utiliser le multi frame de PRT, je dois donc faire des équivalences entre mes graphiques renko 2 et renko8 et donc pour afficher l’indic du renko 8 sur le renko 2 j’ai une delta de x10 .
J’ai changé pas mal de choses mais rien ne fonctionne, Help!!!!
Merci
Kats
Bonjour
L’ensemble de l’indicateur est alimenté à partir de la ligne 9 avec la définition de la source. C’est donc là que vous devrez faire les modifications nécessaires.
Je ne sais pas comment l’indicateur se comporte avec les bougies renko car je ne les utilise pas.
BONSOIR
c bon merci j ai trouve ce weekend
merci de votre reponse
cdlt
Hi,
nice work
I would like to understand something about prorealtime code.
With your indicator, when I open the configutation window, I have 4 check boxes
Filtered TR High Band
Filtered TR Low Band
Filter
Candelstick
The 3 first are from your code (return values)
But where it come from “Candelstick” ? how do you that ?
And also you have a drop down list “Apply to” (close). How you do that ? and it seems to not work, in your code, you have hard coded the source
Thanks
For you work
Hello.
When you use the drawcandle() instruction then in the configuration window you add one more line to configure, the candles.
On the other hand in line 33 there is a variable defined which is the true range. If you don’t say anything about it, PRT interprets that the TR applies by default to close, but you can change it in the configuration window.