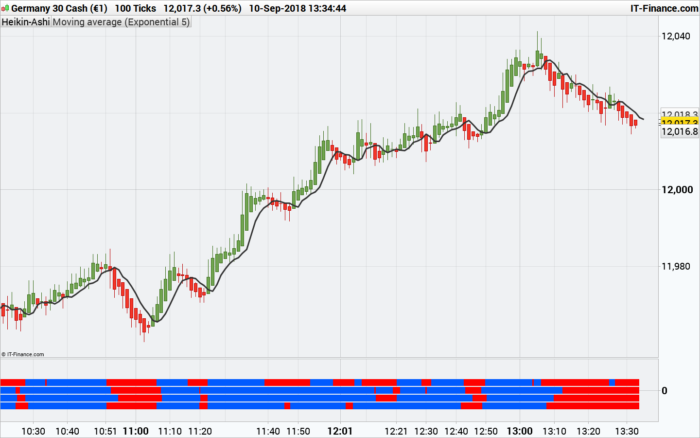
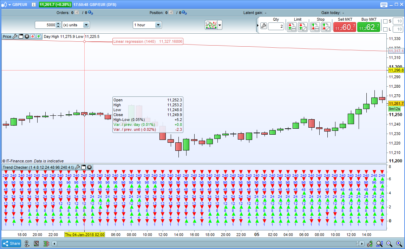
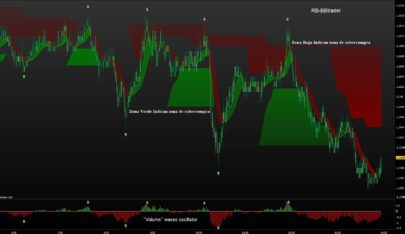
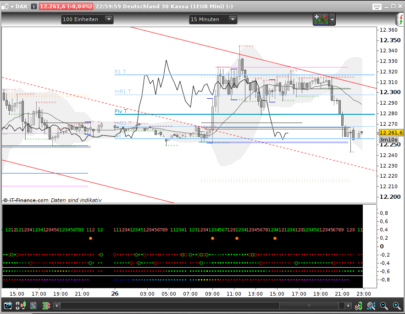
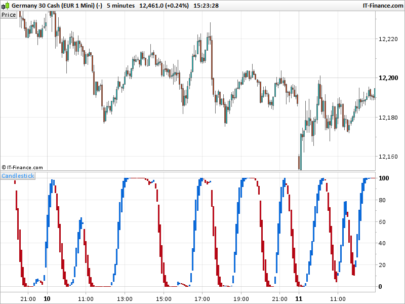
This indicator is a dashboard for the Genesis Matrix trading system. The 4 dots represents (from top to bottom):
- The TVI (Ticks Volumes Indicator) slope (ascending or descending = blue or red)
- CCI above or below 0 (blue or red)
- The T3 moving average slope (ascending or descending = blue or red)
- A GannHiLo signal (close is above the MA of Highs = blue, below the MA of Lows = red)
According to the original rules of the system, orders are triggered once all of the dots are from the same color, in two words, buy when all the dots are turned from red to blue and vice-versa. The complete system could have more rules, but I’m not aware of them.
The TVI needs Volumes to be calculated correctly (will not work on instruments that your broker don’t deal Volumes).
The indicator was converted from MT4 by a request in the spanish forum: Genesis-Matrix.Convertir de MQ4 a PRT
|
1 2 3 4 5 6 7 8 9 10 11 12 13 14 15 16 17 18 19 20 21 22 23 24 25 26 27 28 29 30 31 32 33 34 35 36 37 38 39 40 41 42 43 44 45 46 47 48 49 50 51 52 53 54 55 56 57 58 59 60 61 62 63 64 65 66 67 68 69 70 71 72 73 74 75 76 77 78 79 80 81 82 83 84 85 86 87 |
//PRC_Genesis Matrix | indicator //10.09.2018 //Nicolas @ www.prorealcode.com //Sharing ProRealTime knowledge //converted from MT4 indi // --- settings //TVI_Settings TVIr=12 TVIs=12 TVIu=5 //CCI_Settings CCIPeriod=20 //T3_Settings T3Period=8 //GannHiLo_Settings GannHiLoPeriod=10 // --- end of settings // Set histogram positions IDXTVI=0.25 IDXCCI=0.0 IDXT3=-0.25 IDXGHL=-0.5 //TVI (Ticks Volume Indicator) Mypoint=pointsize UpTicks=(Volume+(Close-Open)/MyPoint)/2 DownTicks=Volume-UpTicks EMAUpTicks=average[TVIr,1](UpTicks) EMADownTicks=average[TVIr,1](DownTicks) DEMAUpTicks=average[TVIs,1](EMAUpTicks) DEMADownTicks=average[TVIs,1](EMADownTicks) TVIcalculate=100.0*(DEMAUpTicks-DEMADownTicks)/(DEMAUpTicks+DEMADownTicks) TVI=average[TVIu,1](TVIcalculate) //ProcessTVI if TVI>=TVI[1] then drawtext("■",barindex,IDXTVI,dialog,bold,20) coloured(0,90,255) else drawtext("■",barindex,IDXTVI,dialog,bold,20) coloured(255,0,0) endif //CCI (Commodity Channel Index) dSig=CCI[CCIPeriod](typicalPrice) //ProcessCCI if dSig>0 then drawtext("■",barindex,IDXCCI,dialog,bold,20) coloured(0,90,255) else drawtext("■",barindex,IDXCCI,dialog,bold,20) coloured(255,0,0) endif //T3 e1 = ExponentialAverage[T3Period](close) e2 = ExponentialAverage[T3Period](e1) e3 = ExponentialAverage[T3Period](e2) e4 = ExponentialAverage[T3Period](e3) e5 = ExponentialAverage[T3Period](e4) e6 = ExponentialAverage[T3Period](e5) b = 0.618 b2 = (b * b) b3 = (b * b * b) c1 = -b3 c2 = (3 * b2) + (3 * b3) c3 = (-6 * b2) - (3 * b) - (3 * b3) c4 = 1 + (3 * b) + b3 + (3 * b2) avg = c1 * e6 + c2 * e5 + c3 * e4 + c4 * e3 //ProcessT3 if avg>=avg[1] then drawtext("■",barindex,IDXT3,dialog,bold,20) coloured(0,90,255) else drawtext("■",barindex,IDXT3,dialog,bold,20) coloured(255,0,0) endif //GannHiLo if Close>average[gannhiloperiod](high)[1] then gann=1 elsif Close<average[gannhiloperiod](low)[1] then gann=-1 endif //ProcessGann if gann>0 then drawtext("■",barindex,IDXGHL,dialog,bold,20) coloured(0,90,255) else drawtext("■",barindex,IDXGHL,dialog,bold,20) coloured(255,0,0) endif return |
Share this
No information on this site is investment advice or a solicitation to buy or sell any financial instrument. Past performance is not indicative of future results. Trading may expose you to risk of loss greater than your deposits and is only suitable for experienced investors who have sufficient financial means to bear such risk.
ProRealTime ITF files and other attachments :
Find other exclusive trading pro-tools on ![]()
PRC is also on YouTube, subscribe to our channel for exclusive content and tutorials


Buenos Días,
habia leido que la estrategia funcionaba bien para periodos inferiores a 1 horas. En periodo superiores que tal se comportaría?…..serviria para acciones?
Gracias
Creo que el indicador sigue siendo válido para cualquier período de tiempo o instrumento. Las condiciones son bastante simples y se basan en indicadores simples, por lo que deben ser consistentes para cualquier instrumento.
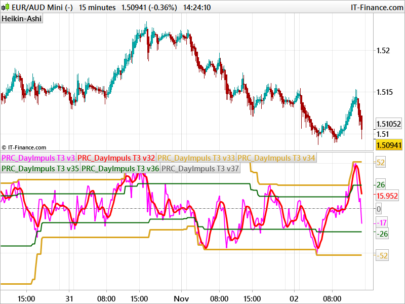
El sistema de trading “Genesis Matrix Trading“, se usa en gráficos de 5 Minutos.
Reglas de entrada a Mercado
* El indicador “Genesis Matrix Trading” debe tener los 4 cuadrados del mismo color al cierre de la vela actual
* Los inidicadores “Stochasticos” tanto el stochastico de 5minutos y el stochastico de 15minutos deben venir del área de 20 – 80
* El indicador Heiken hashi debe cerrar la actual vela por encima o por debajo de la media amarilla 5
Sobre Stop Loss y Take Profit buscaremos áreas de S/R, el sistema nos proporciona un indicador que nos marca las zonas importantes, podemos establecer en esos puntos nuestro TP.
Gracias por la aclaracion
Hello @Nicolas, I have a problem with this indicator. you can check the difference between MT4 and Prorealtime. For me the top bar as already red. ANd you can see small other difference . thank you .
the link of this picture : https://www.cjoint.com/c/HJBmfRi5bGL
ok, but 1. you are comparing different data (same broker or not?), same timezone? same custom trading hours?
2. with IG, there are no Volumes for forex pairs.
3. is it the same version of the dashboard that I have coded?
Bonjour Nicolas. je vais vous parler en français. j’ai un simple abonnement prorealtime (je ne suis pas chez IG). je n’ai pas pris l’option volume. c’est peu etre pour cela que la barre du haut est toujours rouge. après je conçois qu’il y ai une petite différence. certains petits carrées ne sont pas les mêmes. Vous pensez que cette barre rouge que ne deviens jamais bleu viens de ce problème. j’ai simplement télécharger votre indicateur en haut de cette page. y a t’il un autre indicateur qui pourrai remplacer cela. merci
Si il n’y a pas de volumes, le TVI ne pourra pas se calculer, donc oui le “problème” vient bien de cela.
Hi Nicolas, I’m using this indicator when there is confluence over 3 different timeframes (5min, 15min, 1h) together with ADX to confirm the strength of the trend – entering positions in dips / pull-backs. Would it be possible to code a screener that looks for the colour of the 4 boxes of the genesis matrix indicator to match (all blue or all red) and ADX is over 20/25?
Yes it is indeed possible. Create a topic in the screener forum and explain what you need and with screenshots if possible.
i’ve been using this for a few days now and it’s really helped me a lot in timing the execution and closing of trades. is it easily possible to add measurable output that can be used for example in a screener , because when trying it just says “no useable output” – just a row number and 0/1 signal?