The Herrick Payoff Index is designed to show the amount of money flowing into or out of a futures contract. The Index uses open interest during its calculations, therefore, the security being analyzed must contain open interest.
The Herrick Payoff Index was developed by John Herrick.
Interpretation
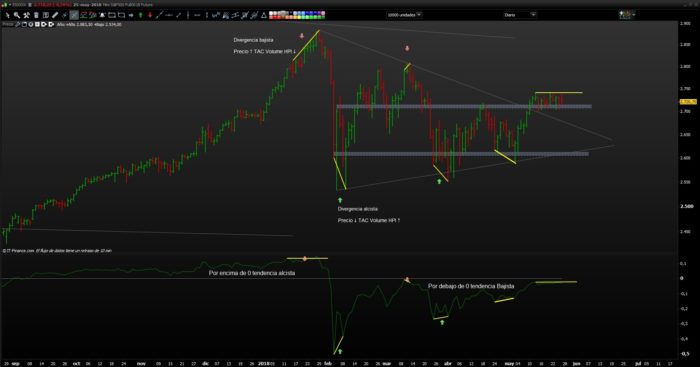
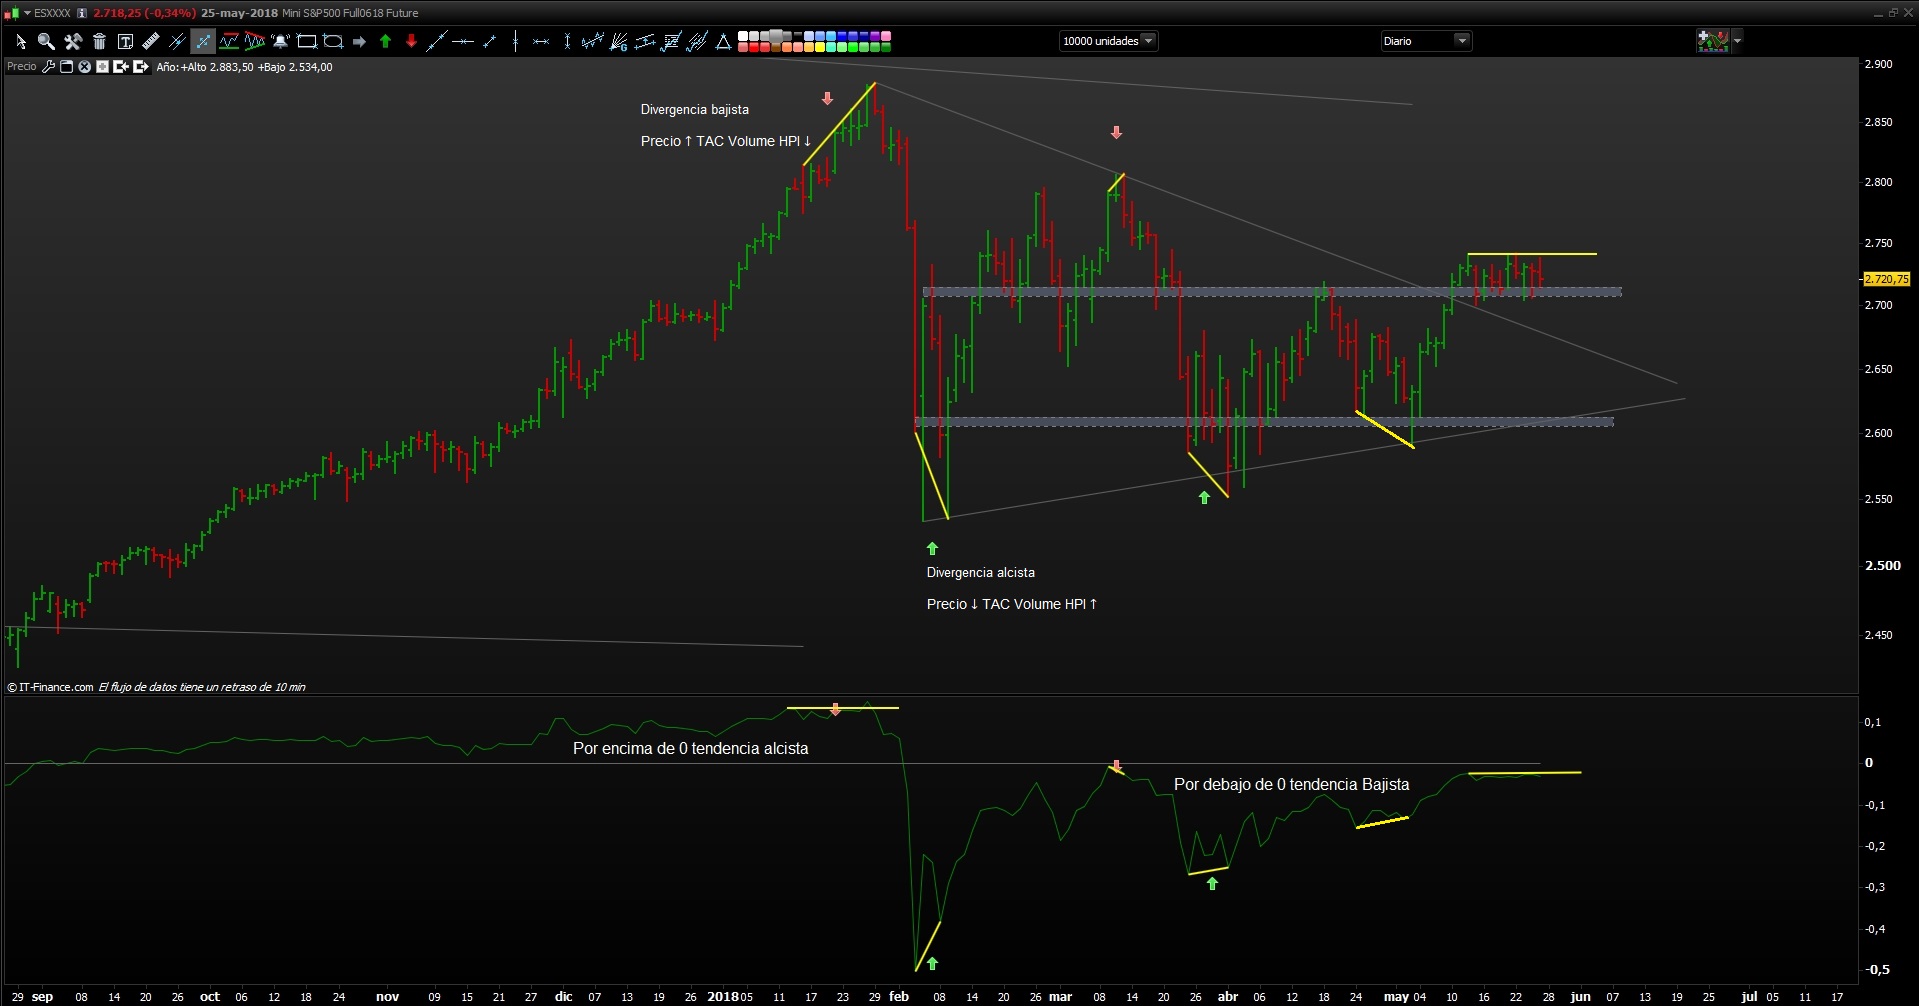
When the Herrick Payoff Index is above zero, it shows that money is flowing into the futures contract (which is bullish). When the Index is below zero, it shows that money is flowing out of the futures contract (which is bearish).
The interpretation of the Herrick Payoff Index involves looking for divergences between the Index and prices.
|
1 2 3 4 5 6 7 8 9 10 11 12 13 14 15 16 17 18 19 20 21 22 23 24 25 26 27 28 29 30 31 32 33 34 35 36 37 38 39 40 41 42 43 |
///////////////////////////////////////////////////////////////////////////////////////////////////////// //TAC Volume HPI 10.3 | indicator //01.01.2018 //RB @ www.tiburonesdealetacorta.com //Sharing ProRealTime ///////////////////////////////////////////////////////////// oi = close openinterestdiff = oi - oi[1] I = abs(openinterestdiff) G = max(oi, oi[1]) S = 10 C = 100 v = volume M = (high + low) / 2 My = M[1] Ky = HPI[1] K1 = (C*V*(M - My))*(1 + ((2 * I)/(G))) K2 = (C*V*(M - My))*(1 - ((2 * I)/(G))) IF M>MY THEN HPI = ((Ky +(K1 - Ky)) * S)/100000 elsif M<MY then HPI = ((Ky +(K2 - Ky)) * S)/100000 endif HPIIndex = 100 * (HPI - lowest[100](HPI))/(highest[100](HPI) - lowest[100](HPI)) wma =WeightedAverage[21](HPI) MM = weightedaverage[150](wma) if wma <= HPIIndex[1] then r=128 g=0 b=0 else r=0 g=128 b=0 endif return wma coloured (r,g,b) style(line,3) as "Herrick Payoff Index",mm coloured (r,g,b) as "SR HPI",HPIIndex COLOURED(102,102,102) as "cero" |
Share this
No information on this site is investment advice or a solicitation to buy or sell any financial instrument. Past performance is not indicative of future results. Trading may expose you to risk of loss greater than your deposits and is only suitable for experienced investors who have sufficient financial means to bear such risk.
ProRealTime ITF files and other attachments :PRC is also on YouTube, subscribe to our channel for exclusive content and tutorials






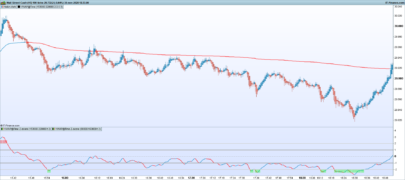


Here you have more information on how it works, along with some improvements on the original indicator.
https://www.prorealcode.com/topic/herrick-payoff-index/
Hi TAC Bolsa, does it work even on shorter timeframe or only on daily? thanks!
Hello
it works in all time frames, I recommend using it in 5 minutes 1 hour, daily and week. Divergences in the Journal are very important.
https://www.prorealcode.com/topic/herrick-payoff-index/
regards
it works in Futures as well as in stocks, indices, less Forex.
thank you!
A question for Tac Bolsa: I enclose a mini S & P photo made with my HPI index and I detect these differences 1) I do not see the same divergence between the end of January 18 and early February; 2) the 0 line is dynamic in my window and is worth 68,422! Should it be set in a way that has not been described on prorealcode or did I make any mistakes?
From this link: I recommend these improved versions for prorealtime.
https://www.tiburonesdealetacorta.com/search/label/Indicador%20Herrick%20Payoff%20Index
Hello
Here is the code of the original creator.
I recommend these improved versions for prorealtime.
https://www.prorealcode.com/topic/herrick-payoff-index/
I do not see the image that you attach, you can include it again.
Thank you so much Tac BOLSA, I can not post the picture tonight I’ll try tomorrow. I loaded the HPI 10.3 Volume TAC indicator and it now works regularly. Thanks again
A new version of TAC Volume HPI DIV10.4 is available. that marks the divergence
In the following link
https://www.prorealcode.com/topic/herrick-payoff-index/
Buenas tardes. Como puedo descargar algunos indicadores de esta pagina ?