







Higher time frame candlestick on a lower time frame chart
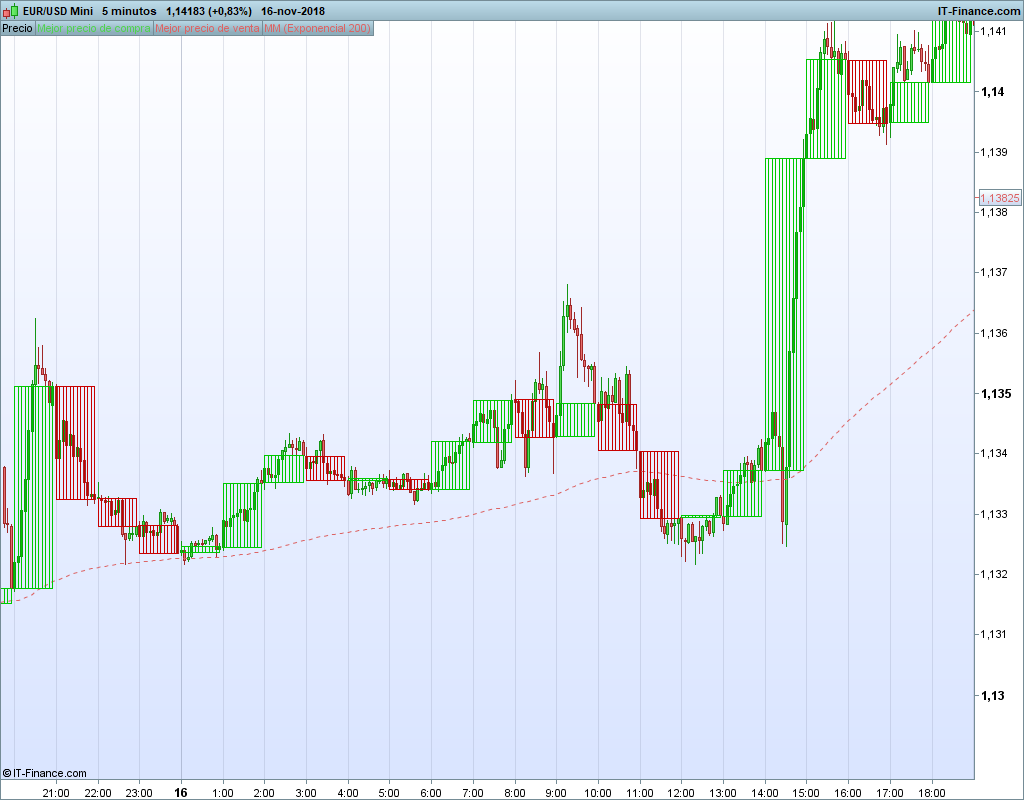
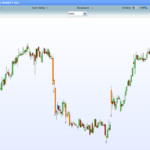
This indicator allows you to draw higher TF candles in the price window.The period of the high TF candles is set in minutes (1 Hour 60, 4 hours 240, one day 1440 etc.)
The high TF candle is drawn as red or green rectangle. As it is not possible to fill a rectangle with color I just added a series of segments to “fill” the body of the candle.
The Heikin Ashi version is available here: Higher time frame Heikin Ashi candles on a lower time frame chart
//Higher TF candles by pableitor 2018
// --- settings
// Timeframeminutes = 60
// --- end of settings

defparam calculateonlastbars=3000 //increase this number to get more history
once fcand=1 //flag for first candle in the chart
if fcand=1 then //if first candle in the chart use first open available
 haopen = open
endif
opd= openday

if (openhour = 0) then
 opd = openday + 1
endif

Myminutes = opd*1440 + openhour*60 + openminute  //total minutes since beginning of chart

if (myminutes MOD Timeframeminutes < myminutes[1] MOD Timeframeminutes ) then //new candle
 haopen = open
 hastart = barindex // position of new candle
 //draw candle
 x1=hastart[1]
 x2=barindex[1]
 y1=haopen[1]
 y2=haclose[1]

 DRAWSEGMENT(x1,y1,x2,y1)coloured(r,g,0)
 DRAWSEGMENT(x1,y1,x1,y2)coloured(r,g,0)
 DRAWSEGMENT(x1,y2,x2,y2)coloured(r,g,0)
 DRAWSEGMENT(x2,y1,x2,y2)coloured(r,g,0)

 FOR i = x1 to x2 do
  DRAWSEGMENT(i,y1,i,y2)coloured(r,g,0)
 next
 fcand=0 // reset flag for first candle
endif

haclose=close

r=0
g=200
if haclose<haopen then
 r=200
 g=0
endif
//DRAWCANDLE(haopen,haopen,haclose,haclose) COLOURED(R,G,0,40) BORDERCOLOR(R,G,0,40)
return
Comments
You must be logged in to post a comment.

Hey Micky, indicator works well, justpaste the code on the platform, or save it as an "itf" file, and then try it. Delete "//" before "Timeframeminutes = 60"
Hi Pableitor, the code is just great; i was playing a lil bit with these factors, darwsegment and drawcandle, the problem lies in centering the candle, in making y1=haopen and y2=haclose plotting lilke y1=haopen[1] and y2=haclose[1], I think it depends on PRT kernel maybe... but what I couldnt solve was the 1 min thing... sometimes 2min is better, its a proxy for 5mins, 1min has too much volatility and opportunities, but sometimes 2min is too big for a shorter TF like 3 or 5sec that is similar to a CME MBO (Market-By-Order) chart, ideal for scalping.
Hi Pableitor, steve Pableitor, hope you are fine. The thing is that when using the drawsegment and drawcandle command, one cannot get the chart in 1min as we did in the original code, its not a continous line, i mean, if we are on 15min timeframe chart and we set the inidcator timeframe on 60mins, the darwsegment and drawdcandle shall be a straight line for 4 candles (4candles x 15min = 1 candle 60min). Hi Steve I think you can change the brightness directly in the chart, no coding is necessary, just change the features in the platform DRAWSEGMENT(x2,y1,x2,y2)coloured(r,g,0) DRAWCANDLE(xopen,xopen,xclose,xclose) COLOURED(R,G,0,40) BORDERCOLOR(R,G,0,40)

Hi Victor, I tried the following code in 1 second chart to get the 1 minute OHLC and it works ! //***** START ****// ONCE HA = 0 // HA = 1 for HEIKEN ASHI CANDLES , HA = 0 for NORMAL CANDLES TIMEFRAME(1minute) // select here the high timeframe ONCE XOPEN = OPEN ONCE XCLOSE = OPEN IF BARINDEX > 1 THEN xClose= HA * totalprice + not(HA) * close xOpen = HA * ( ( xClose[ 1] + xOpen[ 1])/2 ) + not(HA) * open xHigh = high xLow = low ENDIF TIMEFRAME(DEFAULT) RETURN XOPEN as “HTF OPEN” COLOURED (0,0,255) ,XCLOSE AS “HTF CLOSE” COLOURED (0,0,0) , XHIGH as “HTF HIGH” COLOURED(0,192,0), XLOW AS “HTF LOW” COLOURED (255,0,0) //*** END **** // You cannot get higher timeframe values in tick charts because the ticks are asynchronous y'know ( not multiples of 1 minute or anything )
Hi Pableitor, I tried to run the code but it didnt work out, maybe due to a new PRT version? I cannot get the code MTF on 1 minute, yes in 2min but not on 1min in case I want to use tick or charts in seconds. Cheers, VS
Hi Pableitor, How are you doing mate? Hope all is well... I had to change the code (with your premission) I had the same problem, the problem is to estimate or count the hours to get the correct daily candle and get the candle data, but couldt get the xopen and xclose via return line All I got was this, unfortunately xopen and xclose didnt show up as a constant line, but as irregular ones; also, if i used the code on a 10second chart but putting 1 minute timeframe, it returned nothing , but did got a chart if I switched it to "TimeframeHAminutes = 2 " Anyway your indicator is excellent, its a pity I cannot get the 1minute and daily data using your code, it didnt pan out //Higher TF HA candles by pableitor 2018 // --- settings TimeframeHAminutes = 60 //higher TF minutes // --- end of settings //TIMEFRAME(601DAY, updateonclose) ONCE HA = 1 // HA = 1 for HEIKEN ASHI CANDLES , HA = 0 for NORMAL CANDLES ONCE XOPEN = OPEN ONCE XCLOSE = OPEN IF BARINDEX > 1 THEN xClose= HA * totalprice + not(HA) * close xOpen = HA * ( ( xClose[ 1] + xOpen[ 1])/2 ) + not(HA) * open ENDIF TIMEFRAME(DEFAULT) //defparam calculateonlastbars=3000 //increase this number to get more history opd= openday if (openhour = 0) then opd = openday + 1 endif once hightf = 0 once lowtf = close * 100 once ha=0 Myminutes = opd*1440 + openhour*60 + openminute //total minutes since beginning of chart if (myminutes MOD TimeframeHAminutes < myminutes[1] MOD TimeframeHAminutes ) then //new HA candle opentf = open hightf = 0 //fake high lowtf = close * 100 //fake low haopen =( haopen[1]+haclose[1])/2 hastart = barindex // position of new candle x1=hastart[1] x2=barindex[1] y1=haopen[1] y2=haclose[1] DRAWSEGMENT(x1,y1,x2,y1)coloured(r,g,0) DRAWSEGMENT(x1,y1,x1,y2)coloured(r,g,0) DRAWSEGMENT(x1,y2,x2,y2)coloured(r,g,0) DRAWSEGMENT(x2,y1,x2,y2)coloured(r,g,0) ha=1 // flag for first HA candle endif hightf = max(hightf,high) lowtf= min(lowtf,low) if ha = 0 then opentf = open //fake value when theres no HA candles endif if ha=0 then haopen = open endif haclose=(opentf+close+lowtf+hightf)/4 r=0 g=200 if haclose<haopen then r=200 g=0 endif //DRAWCANDLE(haopen,haopen,haclose,haclose) COLOURED(R,G,0,40) BORDERCOLOR(R,G,0,40) DRAWCANDLE(xopen,xopen,xclose,xclose) COLOURED(R,G,0,40) BORDERCOLOR(R,G,0,40) return xopen as "xopen", xclose as "xclose" // https://www.prorealcode.com/prorealtime-indicators/higher-time-frame-heikin-ashi-candles-on-a-lower-time-frame-chart/ //RETURN XOPEN as "HTF OPEN", XCLOSE AS "HTF CLOSE"
ONCE HA = 0 // HA = 1 for HEIKEN ASHI CANDLES , HA = 0 for NORMAL CANDLES TIMEFRAME(1DAY) ONCE XOPEN = OPEN ONCE XCLOSE = OPEN IF BARINDEX > 1 THEN xClose= HA * totalprice + not(HA) * close xOpen = HA * ( ( xClose[ 1] + xOpen[ 1])/2 ) + not(HA) * open xHigh = high xLow = low CLOSEAVG = Average[10](Xclose) ENDIF TIMEFRAME(DEFAULT) RETURN XOPEN as "HTF OPEN" COLOURED (0,0,255) ,XCLOSE AS "HTF CLOSE" COLOURED (0,0,0) , XHIGH as "HTF HIGH" COLOURED(0,192,0), XLOW AS "HTF LOW" COLOURED (255,0,0), CLOSEAVG COLOURED(192,0,192) This code will just return the DAILY OPEN, HIGH, LOW, CLOSE and a 10 period moving average of the DAILY CLOSE in the 1 hour (or lower) Time Frame chart. The only daily value which remain constant in the hourly chart line is the OPEN value, because the other daily values CLOSE, HIGH AND LOW values may change until the final hourly candle 23h candle closes , you know. You can change the standar or heikin ashi OHLC values by settibg the HA flag to 0 or 1 respectively. Rgds
Hey Pableitor, thx vm for the code, I just logged in for a minute, will try it later to show you what I mean, I still dont know how to post pics here, but basically its as if one wanted to put, instead of candles, a continuous line like an average, but for heikin ashi open, and close, with its respective color, and a median made of it. thanks a lot, you are an artist, your indicator are one of the best I have seen. Cheers, mate https://www.prorealcode.com/prorealtime-indicators/candle-mtf-on-price/
If you just want to return the higher time frame (1 day) OPEN & CLOSE lines over the lower time frame (1 hour) candles, just delete the RETURN and add this block of code : TIMEFRAME(1DAY, updateonclose) ONCE HA = 1 // HA = 1 for HEIKEN ASHI CANDLES , HA = 0 for NORMAL CANDLES ONCE XOPEN = OPEN ONCE XCLOSE = OPEN IF BARINDEX > 1 THEN xClose= HA * totalprice + not(HA) * close xOpen = HA * ( ( xClose[ 1] + xOpen[ 1])/2 ) + not(HA) * open ENDIF TIMEFRAME(DEFAULT) RETURN XOPEN as "HTF OPEN",XCLOSE AS "HTF CLOSE" You can use it with HA candles or regular candles by changing the HA variable to 1 or 0 Hope it helps !
Hello Pableitor It wasgreat to see your indicator a long time ago, it looked like a work of art to me ... I was trying to make a modification, which I see is not possible... if one represents the value of open and close in heikin ashi and in MTF (you only give a value to heikinashiopen and heikinashiclose, and apply “return heikinashiopen, heikinashiclose” to see it plotted on teh chart), it gives you a multitimeframe straight line but also an irregular line and not a multitimeframe for each of them (heikinashiopen, heikinashiclose).
Hola Pableitor Tuve ocasion de ver tu indicador hace tiempo, me parecio una obra de arte, seriamente... Yo estuve intentando hacer una modificacion en el indicador, que veo que no es posible... me refiero a que si uno representa el valor de open y del close en heikin ashi y en MTF (unicamente le das un valor al heikinashiopen y heikinashiclose, y le aplicas "return heikinashiopen, heikinashiclose"), en uno te da una linea multitimefame y en otra te sale una linea discontinua y no multitimeframe Sabes como se puede modificar eso, para que ambas salgan como lineas multitimeframe rectas, por ejemplo, si haces un MTF diario en velas de 1hora, y hay 23h (no 24) te saldria una vela recta en 23h como representacion del dia y luego un salto y linea recta para las siguientes 23hs... y porque no reconoce MTF en 1minuto, si lo hace en 2min (si usas segundos)? y como harias MTF diario en velas de 1hora, dado que a veces no coincide?

Great! This is exactly what I was looging for. However, it does not work. I get an error message: "The following variable is not defined: Timeframeminutes" What do I do wrong? Thanks!
The timeframeminutes variable is an external variable to define the higher TF bars . If you download the *.itf file and import it , its plug&play. If you copy the source code to your program you should add the variable Timeframeminutes as an external variable to make it work.

Hi, I have tried to use this indicator in version 12 and it doesn't work. Do you know how to adapt it so that it works well, or if there is another indicator that does the same and works correctly in version 12. Thank you.