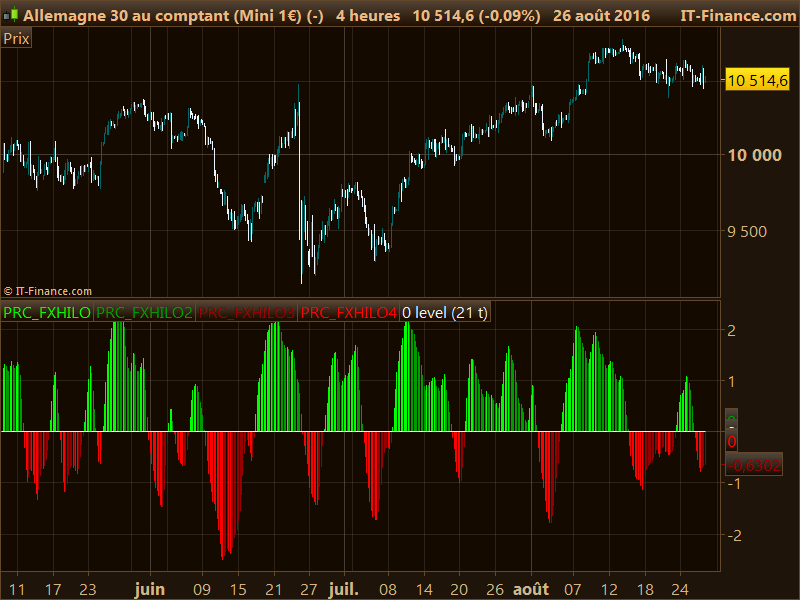
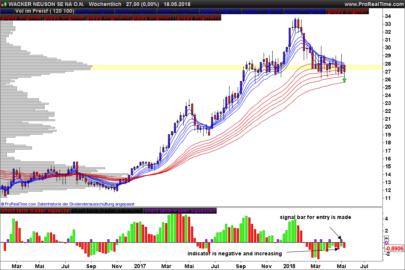
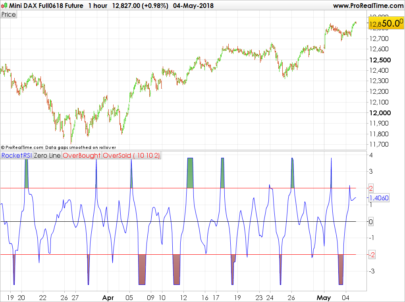
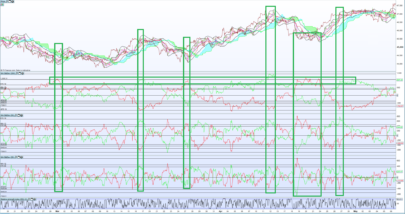
Here is a new oscillator made of a cycle calculation of the median price calculated from the highest high and lowest low of the last x periods.
An adaptive period formula can be activated to calculate the “best” period of the hi/lo channel because of market noises.
I added 4 different returned buffers to identify when the oscillator is increasing or declining above of below the 0 level which represent the bull/bear side of the market.
|
1 2 3 4 5 6 7 8 9 10 11 12 13 14 15 16 17 18 19 20 21 22 23 24 25 26 27 28 29 30 31 32 33 34 35 36 37 38 39 40 41 42 43 44 45 46 47 48 49 50 51 52 53 54 55 56 57 58 59 |
// parameters // myPeriod = 21 // Adaptive = 1 //boolean once f = 0 once g = 0 if barindex>myPeriod then //adaptive period averagePeriod = myPeriod if adaptive=1 and averagePeriod > 1 then price = medianprice minPeriod = round(averagePeriod/2.0) maxPeriod = minPeriod*5.0 endPeriod = round(maxPeriod) signal = Abs((price-stored[endPeriod])) noise = 0.00000000001 for k=1 to endPeriod do noise=noise+Abs(price-stored[k]) averagePeriod = round(((signal/noise)*(maxPeriod-minPeriod))+minPeriod) next endif stored=price averageperiod=max(averageperiod,2) myHigh = Highest[abs(averagePeriod)](high) myLow = Lowest[abs(averagePeriod)](Low) mean = (High + Low) / 2.0 myVAR1 = 0.66 * ((mean - myLow) / (myHigh - myLow) - 0.5) + 0.67 * f myVAR1 = Min(Max(myVAR1, -0.999), 0.999) fxhilo = Log((myVAR1 + 1.0) / (1 - myVAR1)) / 2.0 + g / 2.0 //main line f = myVAR1 g = fxhilo if fxhilo>fxhilo[1] and fxhilo>0 then plusone = fxhilo plustwo = 0 minusone = 0 minustwo = 0 elsif fxhilo<fxhilo[1] and fxhilo>0 then plusone = 0 plustwo = fxhilo minusone = 0 minustwo = 0 elsif fxhilo>fxhilo[1] and fxhilo<0 then plusone = 0 plustwo = 0 minusone = fxhilo minustwo =0 elsif fxhilo<fxhilo[1] and fxhilo<0 then plusone = 0 plustwo = 0 minusone = 0 minustwo = fxhilo endif endif RETURN plusone coloured(0,255,0), plustwo coloured(0,155,0), minusone coloured(150,0,0), minustwo coloured(255,0,0), 0 as "0 level" |
Share this
No information on this site is investment advice or a solicitation to buy or sell any financial instrument. Past performance is not indicative of future results. Trading may expose you to risk of loss greater than your deposits and is only suitable for experienced investors who have sufficient financial means to bear such risk.
ProRealTime ITF files and other attachments :
Find other exclusive trading pro-tools on ![]()
PRC is also on YouTube, subscribe to our channel for exclusive content and tutorials


bonsoir Nicolas,
je réagis tardivement à cet indicateur 🙂 Ne serait-il pas particulièrement adapté dans le cadre de stratégies binaires, dans le sens de la tendance? A tester….
Comme un nombre incalculable d’autres indicateurs codés deci delà, je compte sur d’autres pour les tester et en profiter. Si j’ai eu l’idée de faire cet indicateur à l’époque et de le poster ici, c’est qu’il m’a semblé assez signicatif pour être utilisé. Si tu as des exemples de sa bonne utilisation selon ta propre interprétation, ça m’intéresse d’en discuter 🙂
Dear Nicolas,
First of all, thank you for all your contributions, I always study them with great pleasure. I assume you are the creator of the prc-fxhilo indicator. As an indicator, this indicator is easy to invoke in other indicators. However, in the screening section this does not seem to be the case. Neither as a call function nor in case you use the code directly in a screen builder. Do I miss something or simply can not? Like to hear from you. Sincerely, Gerard
It should not be a problem to use it in a stock screener, what is the problem exactly? Be aware that there are 4 different buffers, 2 for ascending and declining above 0 and the 2 others for when the oscillator is below 0.
Dear Nicolas,
thnx for your reply! In your answer you said: ‘It should not be a problem to use it in a stock screener’. I am afraid that the problem my ‘use direction’ is. In other words: I tried to use the indicator in a forex screener. The second possibility cause of the problem is maybe that I only use the minustwo and the plustwo lines. The other signals are ‘ignored’. Should that possible the problem? Kind regards, Gerard
What condition are you trying to look for? When the oscillator is crossing the zero line?
Dear Nicolas,
‘Reading’ the ‘output’ of the indicator, it seems to me that there are no ‘crossings’. The plustwo finshed at the zero line in case of bearing direction, the minustwo also in case of bullish direction. That’s why I thought to create a screener where the one (for example: minustwo finished at zero line and the plustwo ‘take it over’. That simulates for me a ‘crossing’. Because in my opinion thre are no real crossings, I thought I would solve it by ‘greater than’ (in bullish case) or ‘less than’ ( in bearish case) operators. The remaining variables I thought would turn off with the ‘REM’ command or use the ‘ignored’ construction. De with the ‘Ignored’ command fails and the option with the ‘REM’ gives no results in the screener.
Please, see script below.
Adaptive = 1myPeriod = 14
once f = 0once g = 0
if barindex>myPeriod then
//adaptive periodaveragePeriod = myPeriodif adaptive=1 and averagePeriod > 1 thenprice = medianpriceminPeriod = round(averagePeriod/2.0)maxPeriod = minPeriod*5.0endPeriod = round(maxPeriod)signal = Abs((price-stored[endPeriod]))noise = 0.00000000001
for k=1 to endPeriod donoise=noise+Abs(price-stored[k])averagePeriod = round(((signal/noise)*(maxPeriod-minPeriod))+minPeriod)next
endifstored=priceaverageperiod=max(averageperiod,2)myHigh = Highest[abs(averagePeriod)](high)myLow = Lowest[abs(averagePeriod)](Low)mean = (High + Low) / 2.0myVAR1 = 0.66 * ((mean – myLow) / (myHigh – myLow) – 0.5) + 0.67 * fmyVAR1 = Min(Max(myVAR1, -0.999), 0.999)fxhilo = Log((myVAR1 + 1.0) / (1 – myVAR1)) / 2.0 + g / 2.0 //main linef = myVAR1g = fxhiloif fxhilo>fxhilo[1] and fxhilo>0 thenREM plusone = fxhiloREM plustwo = 0REM minusone = 0minustwo = 0elsif fxhilo<fxhilo[1] and fxhilo>0 thenREM plusone = 0REM plustwo = fxhiloREM minusone = 0minustwo = 0elsif fxhilo>fxhilo[1] and fxhilo<0 thenREM plusone = 0REM plustwo = 0REM minusone = fxhilominustwo =0elsif fxhilo<fxhilo[1] and fxhilo<0 then REM plusone = 0REM plustwo = 0REM minusone = 0minustwo = fxhiloendifendif
// Bullish Sign
If MinusTwo < minusTwo[1] OR MinusTwo[1] < minusTwo[2]ThenCriteria = 110EndIf
Screener [Criteria] (Criteria AS “MinusLow”)
I’ve tried to upload a sceenprint as example, but that was refused by this text editor.
So far my problem.
Kind regards,
Gerard
Sorry, it has needed a lot more customisation of the indicator’s code to get a relevant screener. This code should work (worked for me on a daily timeframe for NASDAQ stocks for instance)
// parameters
myPeriod = 21
Adaptive = 1 //boolean
once f = 0
once g = 0
//adaptive period
averagePeriod = myPeriod
if adaptive=1 and averagePeriod > 1 then
price = medianprice
minPeriod = round(averagePeriod/2.0)
maxPeriod = minPeriod*5.0
endPeriod = round(maxPeriod)
signal = Abs((price-stored[endPeriod]))
noise = 0.00000000001
mymaxbar = 254-maxPeriod
endif
if barindex>mymaxbar then
if adaptive=1 and averagePeriod > 1 then
for k=1 to endPeriod do
noise=noise+Abs(price-stored[k])
averagePeriod = round(((signal/noise)*(maxPeriod-minPeriod))+minPeriod)
next
endif
stored=price
averageperiod=max(averageperiod,2)
myHigh = Highest[abs(averagePeriod)](high)
myLow = Lowest[abs(averagePeriod)](Low)
mean = (High + Low) / 2.0
myVAR1 = 0.66 * ((mean - myLow) / (myHigh - myLow) - 0.5) + 0.67 * f
myVAR1 = Min(Max(myVAR1, -0.999), 0.999)
fxhilo = Log((myVAR1 + 1.0) / (1 - myVAR1)) / 2.0 + g / 2.0 //main line
f = myVAR1
g = fxhilo
endif
condition = g crosses over 0 or g crosses under 0
screener[condition]
Dear Nicolas,
thnx a lot of your screener script. A quick test teaches that it works, also for Forex trading in smaller timeframes. Again, thnx !!!
Gerard
hello
Pour info, j’ai une erreur sur la version actuelle de PRT: un paramètre de type entier positif est attendu pour highest…
As-tu bien enlevé les // devant les paramètres “myPeriod” et “Adaptive” ?
J’ai la même erreur. Pourtant ABS donne par définition un nombre positif
Essayons de remplacer la ligne 27 par:
averageperiod=max(round(averageperiod),2)
Hi!! this is a great indicador, which I regularly use on PRT. However, I’d love to have it on TradingView too, is there any chance it can be converted? Thanks!
We don’t provide TV assistance on our website, to get private paid coding translation use the programming services: https://www.prorealcode.com/trading-programming-services/
Hello, I am still getting the same error even after removing the // in front of the “myPeriod” and “Adaptive” parameters….. Why?