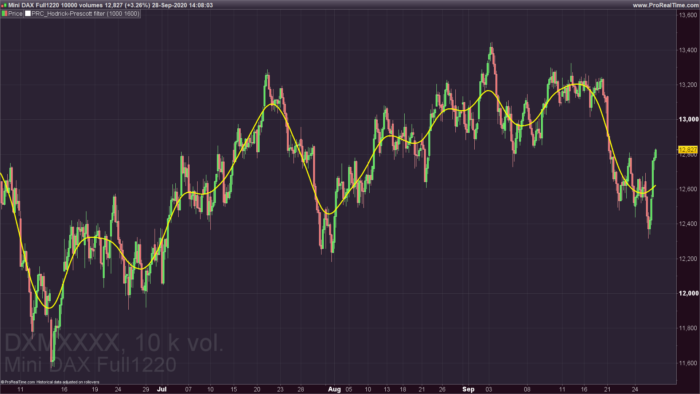
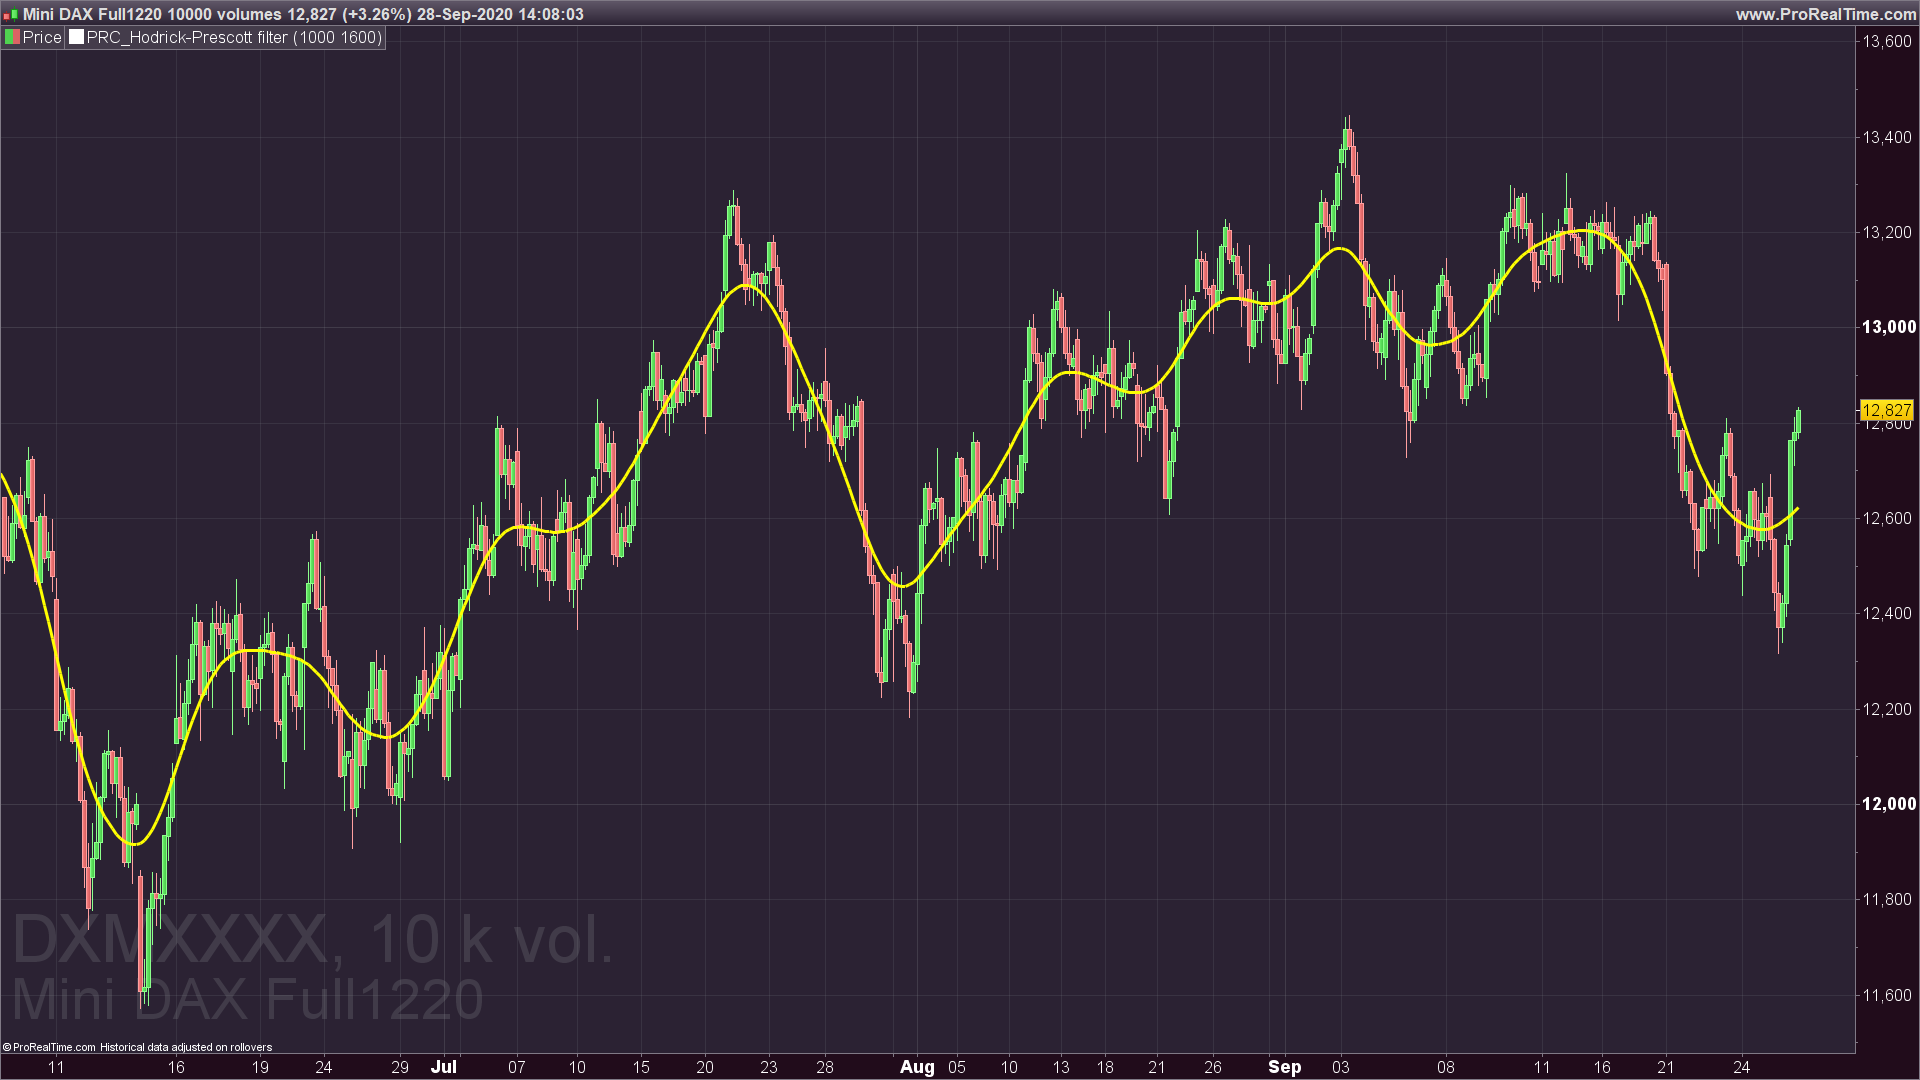
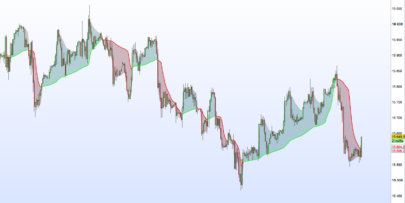
The Hodrick–Prescott filter (also known as Hodrick–Prescott decomposition) is a mathematical tool used in macroeconomics, especially in real business cycle theory, to remove the cyclical component of a time series from raw data. It is used to obtain a smoothed-curve representation of a time series, one that is more sensitive to long-term than to short-term fluctuations. (source Wikipedia: https://en.wikipedia.org/wiki/Hodrick%E2%80%93Prescott_filter)
Be aware that this indicator is continuously rechecking the complete history to redraw the curve to be perfectly in line with the data serie. So it is repainting the past and should not be used “as is” for live trading.
Compatible only with PRT v11 and onwards.
|
1 2 3 4 5 6 7 8 9 10 11 12 13 14 15 16 17 18 19 20 21 22 23 24 25 26 27 28 29 30 31 32 33 34 35 36 37 38 39 40 41 42 43 44 45 46 47 48 49 50 51 52 53 54 55 56 57 58 59 60 61 62 63 64 65 66 67 |
defparam drawonlastbaronly=true //PRC_Hodrick-Prescott filter | indicator //28.09.2020 //Nicolas @ www.prorealcode.com //Sharing ProRealTime knowledge // --- settings nobs =1000 //Number of bars to smooth lambda =1600 //Higher lambda leads to the smoother data // --- end of settings if islastbarupdate and barindex>max(nobs,lambda) then for i=0 to nobs-1 $output[i]=Close[i] next $a[0]=1.0+lambda $b[0]=-2.0*lambda $c[0]=lambda for i=1 to nobs-3 do $a[i]=6.0*lambda+1.0 $b[i]=-4.0*lambda $c[i]=lambda next $a[1]=5.0*lambda+1 $a[nobs-1]=1.0+lambda $a[nobs-2]=5.0*lambda+1.0 $b[nobs-2]=-2.0*lambda $b[nobs-1]=0.0 $c[nobs-2]=0.0 $c[nobs-1]=0.0 //Forward for i=0 to nobs-1 do Z=$a[i]-H4*H1-HH5*HH2 HB=$b[i] HH1=H1 H1=(HB-H4*H2)/Z $b[i]=H1 HC=$c[i] HH2=H2 H2=HC/Z $c[i]=H2 $a[i]=($output[i]-HH3*HH5-H3*H4)/Z HH3=H3 H3=$a[i] H4=HB-H5*HH1 HH5=H5 H5=HC next //Backward H2=0 H1=$a[nobs-1] $output[nobs-1]=H1 for i=nobs-2 downto 0 do $output[i]=$a[i]-$b[i]*H1-$c[i]*H2 H2=H1 H1=$output[i] //drawpoint(barindex[i],$output[i],1) coloured(255,255,0) drawsegment(barindex[i],$output[i],barindex[i+1],$output[i+1]) coloured(255,255,0) style(line,3) next endif return |
Share this
No information on this site is investment advice or a solicitation to buy or sell any financial instrument. Past performance is not indicative of future results. Trading may expose you to risk of loss greater than your deposits and is only suitable for experienced investors who have sufficient financial means to bear such risk.
ProRealTime ITF files and other attachments :PRC is also on YouTube, subscribe to our channel for exclusive content and tutorials








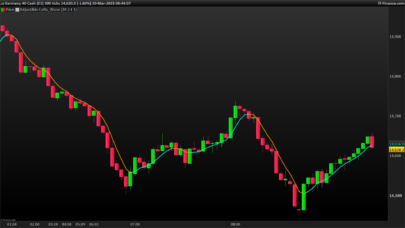
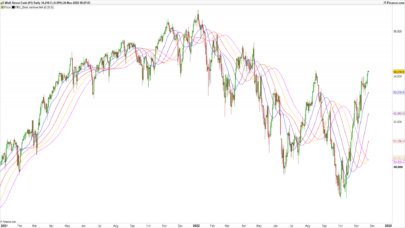


Could be useful in identifying Elliott Waves
Guten Morgen,
ich habe den Indikator importiert, bekomme aber leider nichts angezeigt. Liegt es vielleicht daran, das ich nur die Demoversion 11.1 benutze?
Danke Willi
Nein, es sollte genauso funktionieren mit Demo oder Real Account. Haben Sie es auf die Preisliste angewendet?
Ich habe meinen Fehler gefunden: Das lambda war für meine eingestellte Zeiteinheit zu groß gewählt, mit einem kleineren Wert bekomme ich eine Anzeige.
Danke Willi
Hi Nicolas,
do you plan to release this indicator in version 10.3 as well or is this not practicable due to the usage of arrays?
No because it needs arrays! 🙂
Hi Nicolas,
Can we get the Value of this drawsegment?
i do not understand how this code works
Thank you .
The last value is $output[i], so return $output[i]
Be aware that the indicator is repainting continuously.
Merci Nicolas pour le retour.
En effet on récupère “the Last value” du dernier Point de traçage, après la création d’une variable, AllValuPoint=$output[i] entre les ligne 63 et 64
Est il possible de récupérer Toutes les valeurs du traçage de ce drawsegment?
Merci Nicolas
c’est exactement ce que je fais entre les lignes 58 et 64 pour pouvoir tracer la ligne complète
Nicolas,
Ces matrices sont-elles des vecteurs unidimensionnels ou multidimensionnels?
Depuis maintenant,
Reconnaissant!
Bonjour Nicolas et RicLg,
Merci Nicolas pour cet indicateur intéressant et merci RicLg pour la suggestion.
Toutefois, même en insérant une instruction suggérée par RicLg, je n’arrive pas à faire renvoyer toutes les valeurs qui dessinent le segment, ce qui empêche qu’une alerte se déclenche.
Auriez-vous une idée de ce qui bloque le renvoi de ces valeurs ?
Merci par avance de votre aide