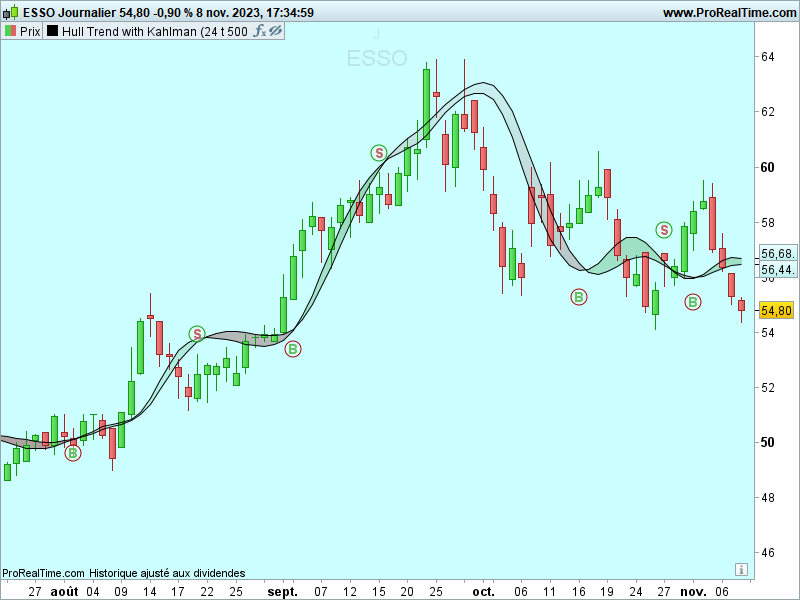
Indicator designed to implement a trading indicator combining a Hull Moving Average (HMA) with a Kahlman filter, used to identify trends and potential buy/sell signals in a financial market. Let’s break it down into simpler terms:
Overview
- Purpose: The script creates a custom trend-following indicator.
- Key Components: It uses a Hull Moving Average (HMA), a variation of the moving average designed to reduce lag and improve smoothness, and a Kalman filter, which is used to estimate the state of a system from noisy data.
How it Works
- Setting Up Variables:
length,showcross,gain,k,nonrepaintingare variables that can be adjusted to modify how the indicator behaves.srcrepresents the source data, typically the closing price of a trading instrument.
- Calculating the Hull Moving Average (HMA):
- The script calculates the HMA and a modified version, referred to as
hma3, based on the closing price (close). These calculations use weighted averages over different periods to reduce lag and increase responsiveness.
- The script calculates the HMA and a modified version, referred to as
- Kalman Filter Implementation:
- The script initializes variables for the Kalman filter:
Pred,Velo,Smooth. - The Kalman filter is applied in a loop, modifying the values of these variables to estimate the “true” state of the market price (
kf) from the noisy input data (src).
- The script initializes variables for the Kalman filter:
- Applying the Filter to the HMA:
- The script calculates two versions of the indicator: one using the raw closing price (
aandbwithout Kalman filter) and another using the Kalman-filtered price (aandbwith Kalman filter).
- The script calculates two versions of the indicator: one using the raw closing price (
- Cross Signals:
- If
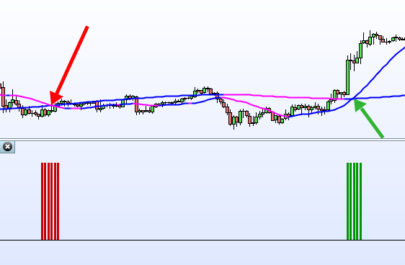
showcrossis true, the script looks for crossover points betweenaandb— these are points where the two lines cross each other. - When
acrosses overb, it’s marked as a “sell” signal (S), and whenacrosses underb, it’s marked as a “buy” signal (B). - The script can optionally mark these signals on the chart using text and points, with an additional option for “non-repainting” mode, which affects how and where these signals are displayed.
- If
- Drawing on the Chart:
- The script uses drawing functions (
DRAWTEXT,DRAWPOINT) to visually represent buy and sell signals on the chart for easier interpretation.
- The script uses drawing functions (
|
1 2 3 4 5 6 7 8 9 10 11 12 13 14 15 16 17 18 19 20 21 22 23 24 25 26 27 28 29 30 31 32 33 34 35 36 37 38 39 40 41 42 43 44 45 46 47 48 49 50 51 52 53 54 55 56 57 58 59 60 61 62 63 64 65 66 67 68 69 70 71 72 73 |
//variables length=24 showcross=1 nonrepainting=0 src=customclose length =length showcross = showcross gain = gain k = k hma= WeightedAverage[ROUND(SQRT(length))](2 * WeightedAverage[ROUND(length / 2)](src) - WeightedAverage[length](src)) // Calcul des composants de l'indicateur HMA3 p=(length/2) wma1 = WeightedAverage[round(p/3)](close) wma2 = WeightedAverage[round(p/2)](close) wma3 = WeightedAverage[round(p)](close) // Calcul de l'indicateur HMA3 ga=3*wma1-wma2-wma3 hma3 = WeightedAverage[round(p)](ga) // Initialisation des variables du filtre de Kalman ONCE Pred = src ONCE Velo = 0 ONCE Smooth = src kf = src // Boucle de calcul pour le filtre de Kalman IF BarIndex > 0 THEN Smooth = Pred + (src-Pred)*SQRT((gain/10000)*2) Velo=Velo+((gain/10000)*(src-Pred)) Pred=Smooth+Velo kf=Pred ENDIF wma1f = WeightedAverage[round(p/3)](kf) wma2f = WeightedAverage[round(p/2)](kf) wma3f = WeightedAverage[round(p)](kf) // Calcul du filtrage de b gaf=3*wma1f-wma2f-wma3f if k then a =WeightedAverage[ROUND(SQRT(length))](2 * WeightedAverage[ROUND(length / 2)](kf) - WeightedAverage[length](kf)) b =WeightedAverage[round(p)](gaf) endif if not k then a = hma b = hma3 endif if showcross then crossdn =a crosses over b atrh = averagetruerange[10](close)*0.5 if nonrepainting=0 then if crossdn then DRAWTEXT("S", barindex-1,high[1]+atrh,dialog,bold,14)coloured(155,0,0) DRAWPOINT(barindex-1,high[1]+atrh,4)coloured(255,255,255,100)bordercolor(0,155,0,250) endif crossup = a crosses under b if crossup then DRAWTEXT("B", barindex-1,b[1]-atrh,dialog,bold,14)coloured(0,155,0) DRAWPOINT(barindex-1,b[1]-atrh,4)coloured(255,255,255,100)bordercolor(155,0,0,250) endif endif if nonrepainting=1 then if crossdn then DRAWTEXT("S", barindex,high+atrh,dialog,bold,14)coloured(155,0,0) DRAWPOINT(barindex,high+atrh,4)coloured(255,255,255,100)bordercolor(0,155,0,250) endif crossup = a crosses under b if crossup then DRAWTEXT("B", barindex,b-atrh,dialog,bold,14)coloured(0,155,0) DRAWPOINT(barindex,b-atrh,4)coloured(255,255,255,100)bordercolor(155,0,0,250) endif endif endif return a as "hull",b as "hull3" |
Share this
No information on this site is investment advice or a solicitation to buy or sell any financial instrument. Past performance is not indicative of future results. Trading may expose you to risk of loss greater than your deposits and is only suitable for experienced investors who have sufficient financial means to bear such risk.
ProRealTime ITF files and other attachments :
Find other exclusive trading pro-tools on ![]()
PRC is also on YouTube, subscribe to our channel for exclusive content and tutorials


There’s a typo in the title. It is not Kahlman but the Kalman filter. Drop the letter h in the name.
Merci Jacques d’avoir répondu à une demande du forum 🙂
bonjour
Petit soucis avec src , dans l’original src = hl/2 soit (high+low)/2
Un idée ?
/@version=4
study(“Hull Trend with Kahlman”, shorttitle=”HMA-Kahlman Trend”, overlay=true)
src = input(hl2, “Price Data”)
length = input(24, “Lookback”)
showcross = input(true, “Show cross over/under”)
gain = input(10000, “Gain”)
k = input(true, “Use Kahlman”)
Bonjour
non pas de soucis car src=customclose donc dans le menu configuration/propriété menu déroulant choisir médian (h+b)/2 ou alors si vous voulez figer cette variable dans le probuilder remplacer src=customclose par src=Median Price
Merci Jacques , indic tres utile. J’ai un indic à programmer avec du price action. es tu dispo pour m’aider à le faire?
ok pour regarder …