

Hypertrend
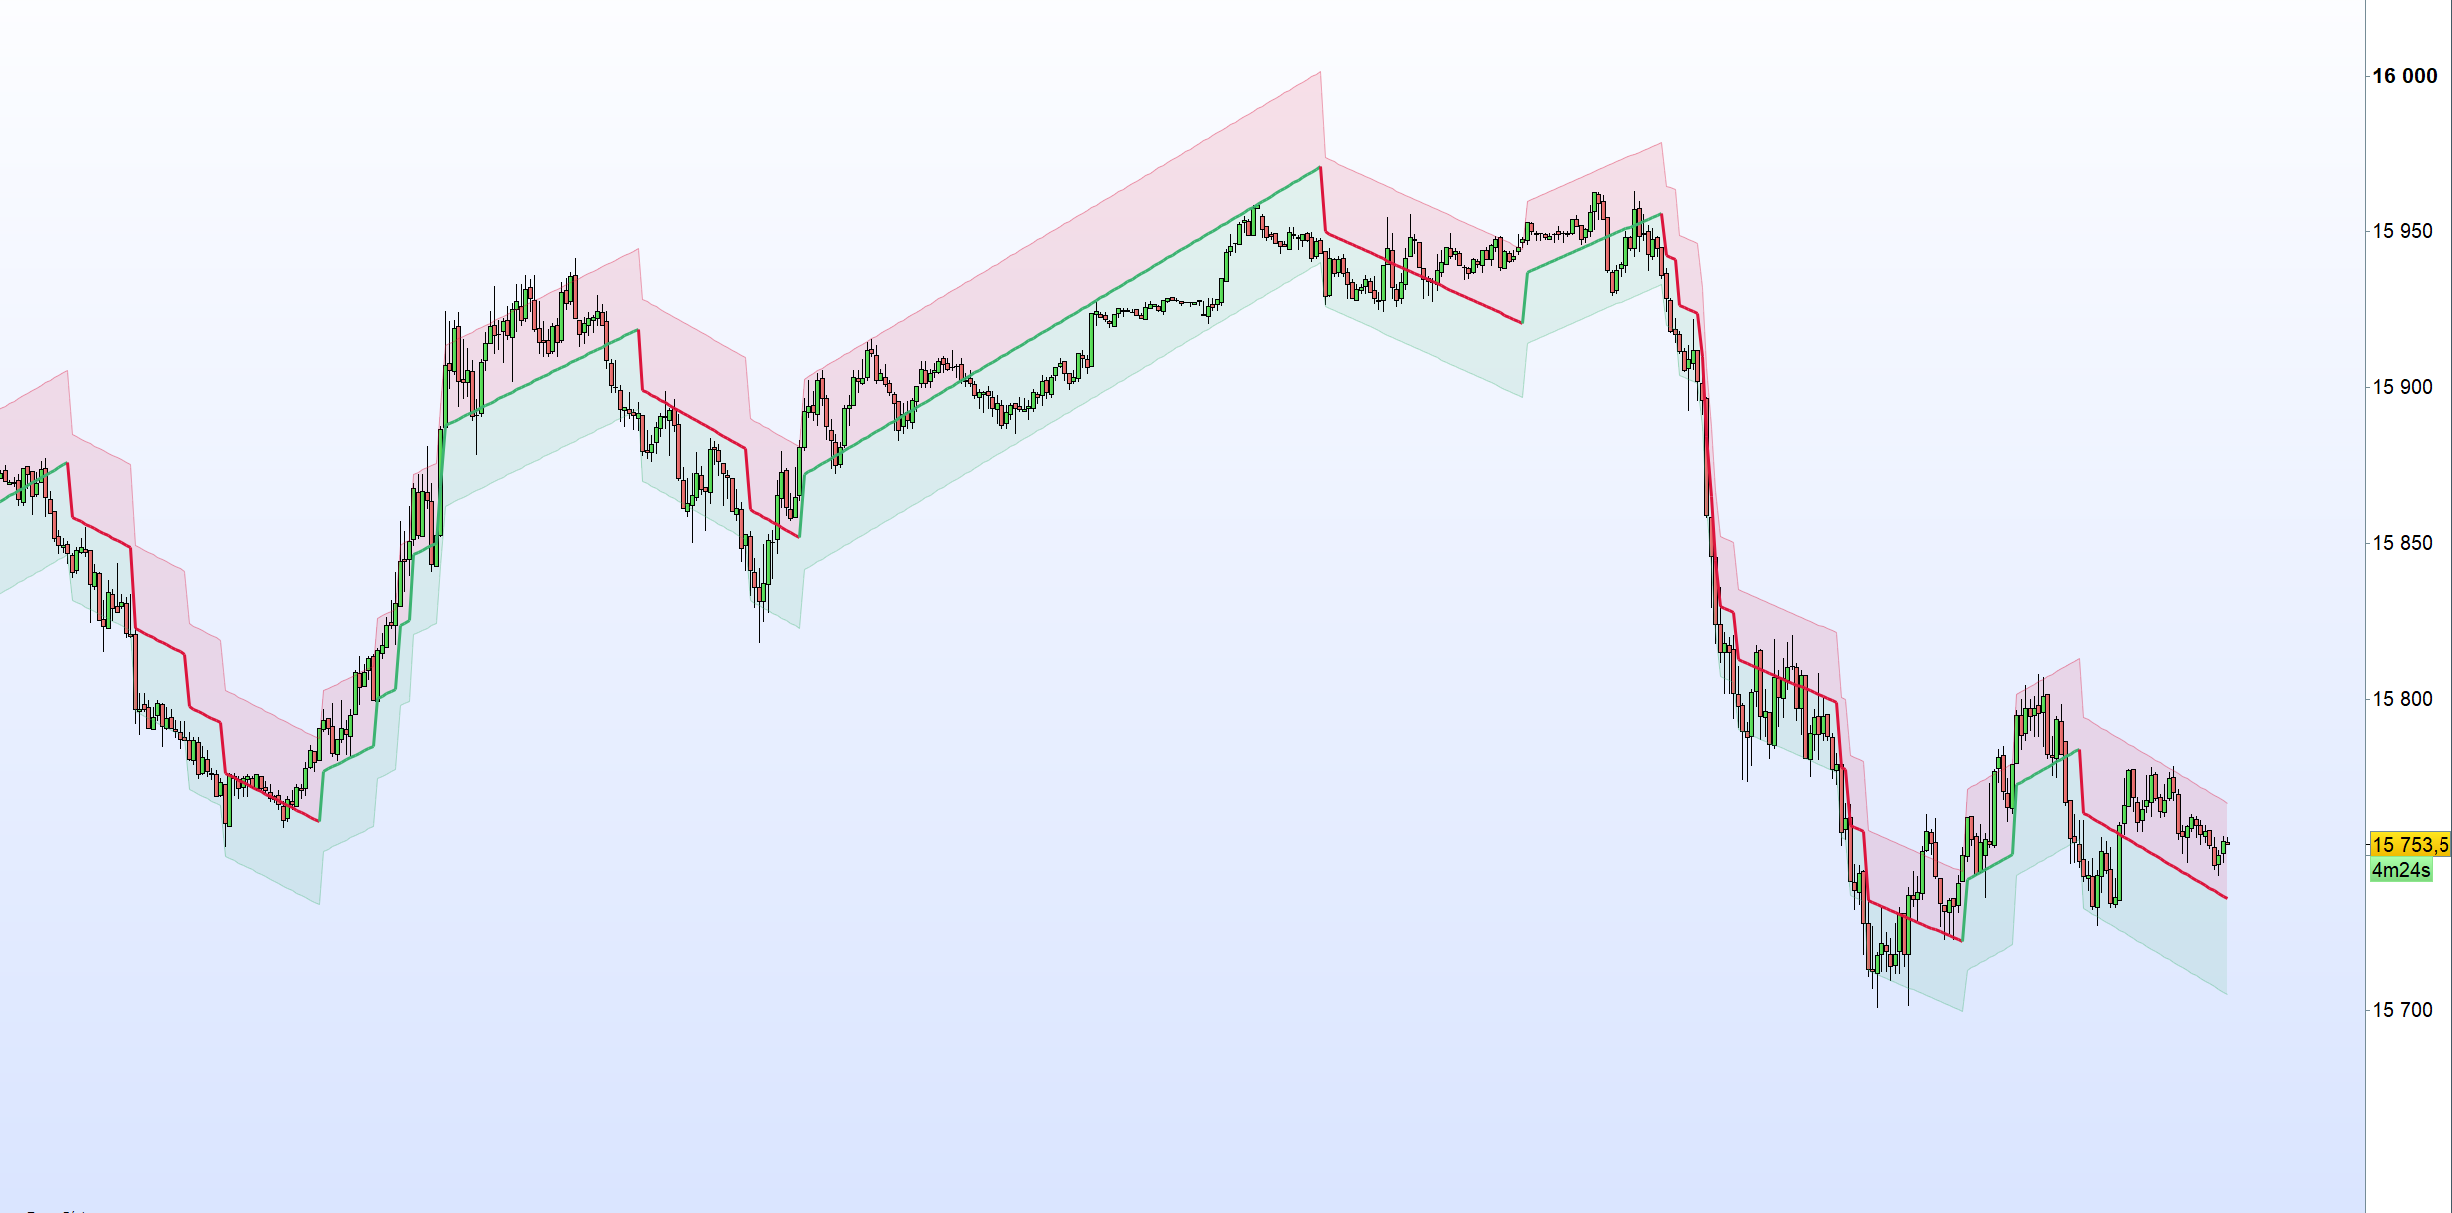
The HyperTrend indicator aims to provide a real-time estimate of an underlying linear trend in the price. Support and resistance extremities are constructed from this estimate which can provide trade opportunities within the overall trend.
Most tools that return lines on a chart are either subject to backpainting or repainting. We aimed to provide a reliable real-time method to estimate linear trends in the price, enhancing traders’ decision making processes when it comes to trading trends in price, hence the term ‘HyperTrend’.
Users can use the HyperTrend to easily determine the trend direction in the price, with an average sloping upward indicating an uptrend, and an average sloping downward indicating a downtrend.
The channels upper extremity can act as a resistance, while the lower extremity can act as a support. Contact with candle wicks can signal timely reversals/retracements
Using a higher “Multiplicative Factor” value will return less frequent new channels, and is suitable to analyze longer-term trends. The slope settings on the other end allow us to control the slope of the returned channels, with higher values returning flatter results (similar to our previously posted predictive ranges).
once avg = close
once hold = 0
once os = 1
once rR = 220
once gR = 20
once bR = 60
once rV = 60
once gV = 179
once bV = 113

if barindex > 200 then
atr = AverageTrueRange[200] * mult


If abs(close - avg) > atr then
avg = (close+avg)/2
//avg = avgN
else
avg = avg + os*(hold/mult/slope)
//avg = avgN
endif

os = sgn(avg - avg[1])

If os <> os[1] then
hold = atr
else
hold = hold[1]
endif

upper = avg + width*hold/100
lower = avg - width*hold/100

If os = 1 then
r = rV
g = gV
b = bV
else
r = rR
g = gR
b = bR
endif

DRAWSEGMENT(barindex-1,avg[1],barindex,avg) COLOURED(r,g,b,255)style(line,3)
DRAWSEGMENT(barindex-1,upper[1],barindex,upper) COLOURED(rR,gR,bR,100)style(line,1)
DRAWSEGMENT(barindex-1,lower[1],barindex,lower) COLOURED(rV,gV,bV,100)style(line,1)
ColorBetween(avg,upper,rR,gR,bR,30)
ColorBetween(avg,lower,rV,gV,bV,30)

endif

Return