
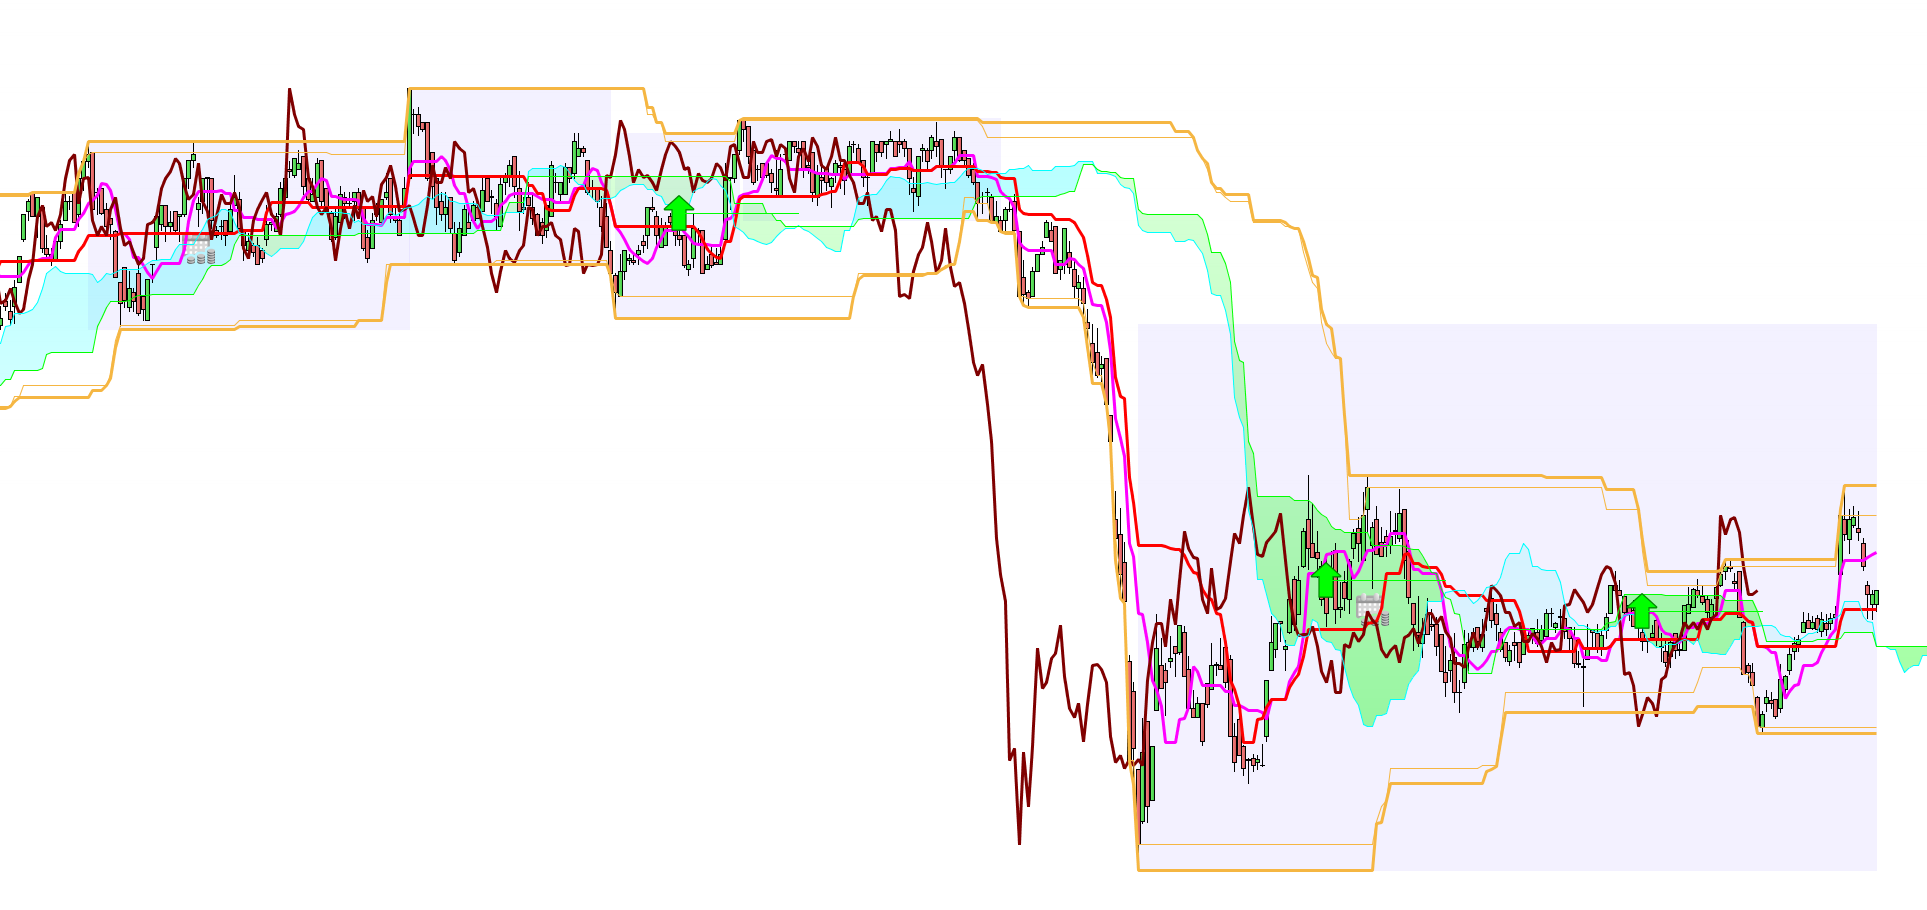
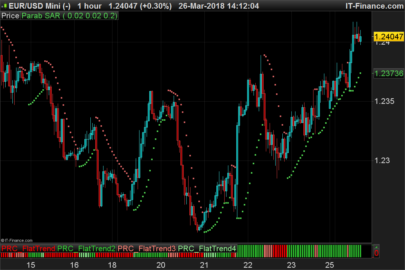
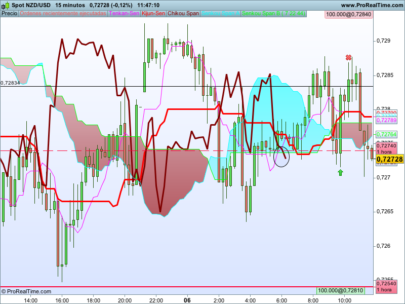
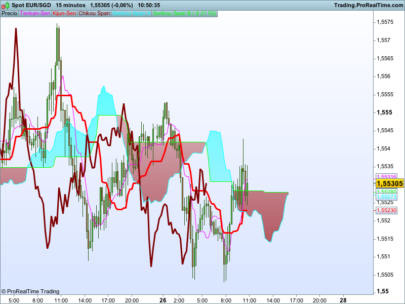
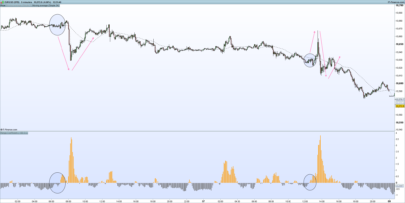
I made this indicator to help me trade neutral trends. In neutral trends it is important to know the range boundaries. So I display the limits of each neutral trend that I detect with a switch of the Ichimoku cloud.
If there is a breakout of the upper or lower bounds of the range in this case the rectangle ends and we switch to a bearish or bullish trend or to another neutral trend. I also display the lines corresponding to the highest and lowest over 52 periods (with or without shadows for the candles). You will also find a target indicated by an arrow with a line going to the relevant twist. This corresponds to the opposite to the Senkou Span B of the price at the time of the twist. This is only displayed for twists that go in the opposite direction to the price.
|
1 2 3 4 5 6 7 8 9 10 11 12 13 14 15 16 17 18 19 20 21 22 23 24 25 26 27 28 29 30 31 32 33 34 35 36 37 38 39 40 41 42 43 44 45 46 47 48 49 50 51 52 53 54 55 56 57 58 59 60 61 62 63 64 65 66 67 68 69 70 71 72 73 |
Tenkan = (highest[9](high)+lowest[9](low))/2 Kijun = (highest[26](high)+lowest[26](low))/2 SSpanA = (Tenkan+Kijun)/2 SSpanB = (highest[52](high)+lowest[52](low))/2 // CROISEMENT SSA et SSB TWIST=(SSpanA[1] < SSpanB[1] and SSpanA > SSpanB) or (SSpanA[1] > SSpanB[1] and SSpanA < SSpanB) if PlusHautAvecMeche <> highest[52](high) and inRange <> 1 then PlusHautAvecMeche=highest[52](high) lastChangeHigh=barindex endif if PlusBasAvecMeche <> lowest[52](low) and inRange <> 1 then PlusBasAvecMeche=lowest[52](low) lastChangeLow=barindex endif if inRange = 1 and (BorneSup < close or BorneInf > close) then inRange=0 rangeLimitStart=rangeStart rangeLimitStop=barindex BorneLimiteSup=BorneSup BorneLimiteInf=BorneInf lastChangeHigh=barindex lastChangeLow=barindex endif if lastChangeLow > lastChangeHigh then lastChange=lastChangeHigh else lastChange=lastChangeLow endif if twist then if SSpanB < close and SSpanB > SSpanA then objectif = SSpanB - (close - SSpanB) drawarrowdown(barindex,objectif) coloured(255,0,0) drawsegment(barindex,objectif,barindex+26,objectif) coloured(255,0,0) elsif SSpanB > close and SSpanB < SSpanA then objectif = SSpanB + (SSpanB - close) drawarrowup(barindex,objectif) coloured(0,255,0) drawsegment(barindex,objectif,barindex+26,objectif) coloured(0,255,0) endif if inRange <> 1 then inRange=1 rangeStart=lastChange BorneSup=highest[52](high) BorneInf=lowest[52](low) endif endif x=highest[52](close) y=highest[52](open) if (x>y) then PlusHautSansMeche=x else PlusHautSansMeche=y endif x=lowest[52](close) y=lowest[52](open) if (x>y) then PlusBasSansMeche=y else PlusBasSansMeche=x endif if barindex=rangeLimitStop then DRAWRECTANGLE(rangeLimitStart,BorneLimiteSup,rangeLimitStop,BorneLimiteInf) coloured(177,163,255,40) bordercolor(0,0,0,0) elsif isLastBarUpdate and inRange=1 then DRAWRECTANGLE(rangeStart,BorneSup,barindex,BorneInf) coloured(177,163,255,40) bordercolor(0,0,0,0) endif return highest[52](high) coloured(245,182,66) AS "Ichimoku Highest",lowest[52](Low) coloured(245,182,66) AS "Ichimoku Lowest",PlusHautSansMeche coloured(245,182,66) as "Plus Haut Sans Meche", PlusBasSansMeche coloured(245,182,66) as "Plus Bas Sans Meche" |
Share this
No information on this site is investment advice or a solicitation to buy or sell any financial instrument. Past performance is not indicative of future results. Trading may expose you to risk of loss greater than your deposits and is only suitable for experienced investors who have sufficient financial means to bear such risk.
ProRealTime ITF files and other attachments :
Find other exclusive trading pro-tools on ![]()
PRC is also on YouTube, subscribe to our channel for exclusive content and tutorials


Great job!
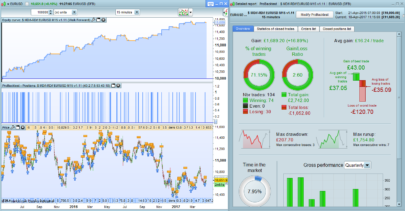
Ranges are very well positioned, including this indicator in trend tracking algorithms could be interesting.
Thank you
Thanks if you notice some issues I’d be glad to hear about them.
I have an error message line 68 about “bordercolor”… is it because i use V10.3 or do i have to change something in the code ?
Line 68 and 70, you must delete the instruction at the end of the line “” Bordercolor(0,0,0,0) “”.
This instruction is for the V11 maybe that you are using V10.3 then you can safely remove it.
Bonjour,
Je vois l’instruction inRange mais je ne trouve pas sa signification.
Pouvez-vous m’expliquer SVP
Merci bien!