1. Introduction
The ICT (Inner Circle Trader) market analysis is known for identifying key moments within trading sessions that offer great opportunities due to volatility and liquidity. This ICT indicator is designed to highlight those time windows, known as Kill Zones, where price movements tend to be more pronounced. These periods correspond to the start of major global trading sessions: Asia, London, New York, and the London close.
Additionally, the ICT indicator also plots zones known as Silver Bullets, which are specific moments within sessions where the market tends to make a significant move. Another important tool in ICT analysis is the identification of Fair Value Gaps (FVG), areas where price moves quickly leaving regions with little trading, indicating imbalance and possible reversal zones.
2. Description of the ICT Indicator
The ICT indicator aims to provide visual information about the most relevant trading sessions of the day, helping traders identify areas with a higher probability of significant movements. The main features are:
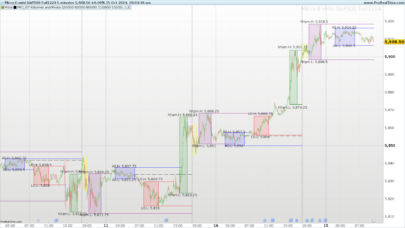
- Kill Zones: Four key periods of the day are highlighted, each representing the start of a major trading session.
- Asian Kill Zone: From 08:00 PM to 10:00 PM (NY UTC -4).
- London Kill Zone: From 02:00 AM to 05:00 AM (NY UTC -4).
- New York Kill Zone: From 07:00 AM to 09:00 AM (NY UTC -4).
- London Close Kill Zone: From 10:00 AM to 12:00 PM (NY UTC -4).
- Silver Bullet: These are smaller windows of opportunity within the London and New York sessions, where a sharp price movement can be detected in a short period.
- London Open Silver Bullet: 03:00 AM – 04:00 AM (NY UTC -4).
- AM Session Silver Bullet: 10:00 AM – 11:00 AM (NY UTC -4).
- PM Session Silver Bullet: 02:00 PM – 03:00 PM (NY UTC -4).
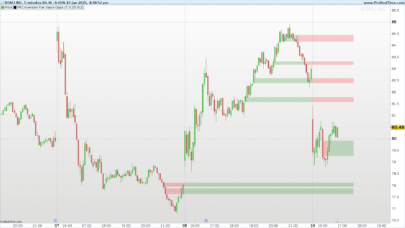
- Fair Value Gaps (FVG): These are areas on the chart where price hasn’t interacted within a range of bars, creating an imbalance. These zones are automatically plotted and allow traders to identify potential entry or reversal points.
3. Features and Elements of the Indicator
Kill Zones
The Kill Zones are times of day when institutional traders are most active, often leading to higher volatility in prices. This indicator automatically highlights these periods so that traders can stay alert for potential trading opportunities.
- Asian Kill Zone: This zone spans from 8:00 PM to 10:00 PM New York time, which corresponds to the opening of the Asian session. It’s a period where liquidity accumulates before the London session.
- London Kill Zone: This period activates from 2:00 AM to 5:00 AM New York time, marking the start of the London session, considered one of the most volatile times of the day.
- New York Kill Zone: It stretches from 7:00 AM to 9:00 AM New York time, just before the New York Stock Exchange opens. It’s a key time for volatility due to high institutional trading activity.
- London Close Kill Zone: This zone activates from 10:00 AM to 12:00 PM New York time, when the London session approaches its close, and European institutions finalize their trades, often causing sharp price movements.
Silver Bullet
The Silver Bullets are smaller periods within the Kill Zones where rapid movements with little retracement occur. Both the London and New York sessions are especially prone to these moves, and they are marked on the chart for traders to be ready for entry opportunities.
Fair Value Gaps (FVG)
The concept of Fair Value Gaps is essential to ICT analysis. These zones are created when the market moves quickly, leaving price areas untraded, indicating an imbalance. The ICT indicator automatically identifies these zones on the chart.
A bullish FVG occurs when the price rises sharply, leaving a gap between the low of bar 3 and the high of bar 1. Conversely, a bearish FVG is created when the price drops rapidly, leaving a gap between the high of bar 3 and the low of bar 1.
4. Configuration and Customization
The ICT indicator is highly customizable, allowing traders to adjust various settings to suit their needs:
- diferenciahoraria: This setting adjusts the time difference between the platform and New York (UTC -4), adapting to the user’s geographical location.
- drawbackground: Enables or disables the background colors that indicate the Kill Zones, providing a clear visual representation of these periods on the chart.
- drawareas: Activates the display of specific areas for Kill Zones and Silver Bullets, outlining the exact time and price range.
- drawsignals: Enables visual signals, showing text and boxes that identify the Kill Zones and Silver Bullets.
- drawclosinglevels: This option displays post-close price levels, showing lines at key prices after the close of major sessions.
- rangofvg: Defines the minimum size for identifying a Fair Value Gap. If the gap between the high and low exceeds this value, the indicator will mark it on the chart.
- rangosegmentosfvg: Allows the division of FVGs into smaller segments, facilitating analysis within these zones.
- opacidad: Controls the transparency of drawn areas and backgrounds, allowing the user to adjust visibility based on their preference.
5. Practical Application
This indicator is especially useful for traders following the ICT strategy. The clear visual representation of Kill Zones, combined with Silver Bullets and Fair Value Gaps, allows traders to make informed decisions during key market moments. Below are some examples of how to use the indicator:
- During the Asian session: If the indicator marks a Kill Zone during the Asian session and price shows accumulation within an FVG, it could be a good opportunity to prepare a trade for the London session.
- At the New York open: The New York Kill Zone is known for its high volatility. Identifying a Silver Bullet during this period may offer an excellent opportunity to take advantage of a sharp, significant move.
6. Conclusion
The ICT indicator is a powerful tool for traders who follow Inner Circle Trader concepts. By visually highlighting key volatility zones, Silver Bullets, and Fair Value Gaps, the indicator helps traders identify opportunities more clearly. With its multiple customization options, this indicator adapts to individual trader needs, providing dynamic and clear visual analysis.
This indicator is ideal for use in combination with other technical analysis tools, and its flexibility allows it to be integrated into various trading strategies.
|
1 2 3 4 5 6 7 8 9 10 11 12 13 14 15 16 17 18 19 20 21 22 23 24 25 26 27 28 29 30 31 32 33 34 35 36 37 38 39 40 41 42 43 44 45 46 47 48 49 50 51 52 53 54 55 56 57 58 59 60 61 62 63 64 65 66 67 68 69 70 71 72 73 74 75 76 77 78 79 80 81 82 83 84 85 86 87 88 89 90 91 92 93 94 95 96 97 98 99 100 101 102 103 104 105 106 107 108 109 110 111 112 113 114 115 116 117 118 119 120 121 122 123 124 125 126 127 128 129 130 131 132 133 134 135 136 137 138 139 140 141 142 143 144 145 146 147 148 149 150 151 152 153 154 155 156 157 158 159 160 161 162 163 164 165 166 167 168 169 170 171 172 173 174 175 176 177 178 179 180 181 182 183 184 185 186 187 188 189 190 191 192 193 194 195 196 197 198 199 200 201 202 203 204 205 206 207 208 209 210 211 212 213 214 215 216 217 218 219 220 221 222 223 224 225 226 227 228 229 230 231 232 233 234 235 236 237 238 239 240 241 242 243 244 245 246 247 248 249 250 251 252 253 254 255 256 257 258 259 260 261 262 263 264 265 266 |
// Author: toniyecla - contact@rescommunesomnium.com // basado en los conceptos de The Inner Circle Trader - https://www.youtube.com/@InnerCircleTrader diferenciahoraria = 6 drawbackground = 1 drawareas = 1 drawsignals = 1 drawclosinglevels=1 rangofvg = 0 rangosegmentosfvg = 4 drawfvg=1 once fvg = 1 once opacidad = 1 once NbBar = 1 MyDay=openday dayminutes = 1440*(MyDay-MyDay[1]) MyHour=openhour hourminutes = 60*(MyHour-MyHour[1]) MyMin=openminute barminutes = MyMin - MyMin[1] + hourminutes + dayminutes barminutes=abs(barminutes) Mybarminutes = lowest[NbBar](barminutes)[1] if (Mybarminutes <= 60 and opensecond = 0) then periodos = 60 / Mybarminutes if (opensecond <> opensecond[1]) then periodos = 60 * 4 endif //// KILL ZONES // ICT Asian Kill Zone (08:00 PM - 10:00 PM, NY UTC -4) asian = 22 + diferenciahoraria // ICT London Kill Zone (02:00 AM - 05:00 AM, NY UTC -4) london = 5 + diferenciahoraria // ICT New York Kill Zone (07:00 AM - 09:00 AM, NY UTC -4) ny = 9 + diferenciahoraria // ICT London Close Kill Zone (10:00 AM - 12:00 PM, NY UTC -4) londonclose = 12 + diferenciahoraria if (asian > 23) then asian = asian - 24 endif if (london > 23) then london = london - 24 endif if (ny > 23) then ny = ny - 24 endif if (londonclose > 23) then londonclose = londonclose - 24 endif // BACKGROUND if drawbackground then if (hour[1] = asian - 2 or hour[1] = asian - 1) then backgroundcolor(0, 0, 0, 16 * opacidad) endif if (hour[1] = london - 3 or hour[1] = london - 2 or hour[1] = london - 1) then backgroundcolor(0, 64, 0, 24 * opacidad) endif if (hour[1] = ny - 2 or hour[1] = ny - 1) then backgroundcolor(0, 0, 64, 32 * opacidad) endif if (hour[1] = londonclose - 2 or hour[1] = londonclose - 1) then backgroundcolor(0, 64, 0, 24 * opacidad) endif endif // AREAS if drawareas then if (hour[1] = asian and minute[1] = 0) or (hour[1] = london and minute[1] = 0) or (hour[1] = ny and minute[1] = 0) or (hour[1] = londonclose and minute[1] = 0) then if (hour[1] = london) then x0 = barindex[periodos * 3] y0 = highest[periodos * 3](high[1]) x1 = barindex[1] y1 = lowest[periodos * 3](low[1]) else x0 = barindex[periodos * 2] y0 = highest[periodos * 2](high[1]) x1 = barindex[1] y1 = lowest[periodos * 2](low[1]) endif DRAWRECTANGLE(x0, y0, x1, y1) coloured(255, 255, 255, 96) bordercolor(255, 255, 255, 0) endif endif // SIGNAL if drawsignals then if (IsLastBarUpdate = 1) then if (hour[1] = asian - 2 or hour[1] = asian - 1) then DRAWRECTANGLE(-5, -24, -138, -40) coloured(255, 255, 255, 255) bordercolor(255, 255, 255, 0) anchor(TOPRIGHT) drawtext("ASIAN KILL ZONE", -71, -31, SansSerif, Standard, 8) coloured(0, 0, 0, 255) anchor(TOPRIGHT) endif if (hour[1] = london - 3 or hour[1] = london - 2 or hour[1] = london - 1) then DRAWRECTANGLE(-5, -24, -138, -40) coloured(255, 255, 255, 255) bordercolor(255, 255, 255, 0) anchor(TOPRIGHT) drawtext("LONDON KILL ZONE", -71, -31, SansSerif, Standard, 8) coloured(0, 0, 0, 255) anchor(TOPRIGHT) endif if (hour[1] = ny - 2 or hour[1] = ny - 1) then DRAWRECTANGLE(-5, -24, -138, -40) coloured(255, 255, 255, 255) bordercolor(255, 255, 255, 0) anchor(TOPRIGHT) drawtext("NEW YORK KILL ZONE", -71, -31, SansSerif, Standard, 8) coloured(0, 0, 0, 255) anchor(TOPRIGHT) endif if (hour[1] = londonclose - 2 or hour[1] = londonclose - 1) then DRAWRECTANGLE(-5, -24, -138, -40) coloured(255, 255, 255, 255) bordercolor(255, 255, 255, 0) anchor(TOPRIGHT) drawtext("LONDON CLOSE KILL ZONE", -71, -31, SansSerif, Standard, 8) coloured(0, 0, 0, 255) anchor(TOPRIGHT) endif endif endif //// SILVER BULLET // The London Open Silver Bullet (03:00 AM - 04:00 AM, NY UTC -4) london = 4 + diferenciahoraria // The AM session Silver Bullet (10:00 AM - 11:00 AM, NY UTC -4) am = 11 + diferenciahoraria // The PM session Silver Bullet (02:00 PM - 03:00 PM, NY UTC -4) pm = 15 + diferenciahoraria if (london > 23) then london = london - 24 endif if (am > 23) then am = am - 24 endif if (pm > 23) then pm = pm - 24 endif // BACKGROUND if drawbackground then if (hour[1] = london - 1) then backgroundcolor(255, 255, 0, 24 * opacidad) endif if (hour[1] = am - 1) then backgroundcolor(255, 255, 0, 24 * opacidad) endif if (hour[1] = pm - 1) then backgroundcolor(255, 255, 0, 24 * opacidad) endif endif // AREAS if drawareas then if (hour[1] = london and minute[1] = 0) or (hour[1] = am and minute[1] = 0) or (hour[1] = pm and minute[1] = 0) then x0 = barindex[periodos] y0 = highest[periodos](high[1]) x1 = barindex[1] y1 = lowest[periodos](low[1]) DRAWRECTANGLE(x0, y0, x1, y1) coloured(0, 0, 0, 0) bordercolor(0, 0, 0, 64) STYLE(dottedline1, 1) endif endif // SIGNAL if drawsignals then if (IsLastBarUpdate = 1) then if (hour[1] = london - 1) then DRAWRECTANGLE(-5, -5, -138, -21) coloured(0, 0, 0, 0) bordercolor(0, 0, 0, 255) STYLE(dottedline1, 1) anchor(TOPRIGHT) drawtext("LONDON SILVER BULLET", -71, -12, SansSerif, Standard, 8) coloured(0, 0, 0, 255) anchor(TOPRIGHT) endif if (hour[1] = am - 1) then DRAWRECTANGLE(-5, -5, -138, -21) coloured(0, 0, 0, 0) bordercolor(0, 0, 0, 255) STYLE(dottedline1, 1) anchor(TOPRIGHT) drawtext("AM SESSION SILVER BULLET", -71, -12, SansSerif, Standard, 8) coloured(0, 0, 0, 255) anchor(TOPRIGHT) endif if (hour[1] = pm - 1) then DRAWRECTANGLE(-5, -5, -138, -21) coloured(0, 0, 0, 0) bordercolor(0, 0, 0, 255) STYLE(dottedline1, 1) anchor(TOPRIGHT) drawtext("PM SESSION SILVER BULLET", -71, -12, SansSerif, Standard, 8) coloured(0, 0, 0, 255) anchor(TOPRIGHT) endif endif endif //// FVG if drawfvg then if (hour[1] = 9 and minute[2] = 0) or (hour[1] = 15 and minute[2] = 30 + Mybarminutes) then fvg = 0 endif alcista = close[2] > open[2] if (alcista) then maximo = low[1] minimo = high[3] if (maximo-minimo > rangofvg) then if (fvg = 1) then drawrectangle(barindex[2], maximo, barindex + 1, minimo) coloured (0,157,157,32) bordercolor (0,153,153,0) if (maximo-minimo > rangosegmentosfvg) then drawsegment(barindex[2], maximo - (maximo - minimo) / 2, barindex + 1, maximo - (maximo - minimo) / 2) coloured (255,255,255,96) drawsegment(barindex[2], maximo - (maximo - minimo) / 4, barindex + 1, maximo - (maximo - minimo) / 4) coloured (255,255,255,96) drawsegment(barindex[2], minimo + (maximo - minimo) / 4, barindex + 1, minimo + (maximo - minimo) / 4) coloured (255,255,255,96) endif else // opening fvg drawrectangle(barindex[2], maximo, barindex + 10000, minimo) coloured (0,157,157,24) bordercolor (0,153,153,0) if (maximo-minimo > rangosegmentosfvg) then drawsegment(barindex[2], maximo - (maximo - minimo) / 2, barindex + 1, maximo - (maximo - minimo) / 2) coloured (255,255,255,96) drawsegment(barindex[2], maximo - (maximo - minimo) / 4, barindex + 1, maximo - (maximo - minimo) / 4) coloured (255,255,255,96) drawsegment(barindex[2], minimo + (maximo - minimo) / 4, barindex + 1, minimo + (maximo - minimo) / 4) coloured (255,255,255,96) endif endif if (maximo-minimo > 1.5 or maximo < 10000) then // dibuja también el siguiente en caso de ser muy pequeño, <10000 evita el SP500 fvg = 1 endif endif else maximo = low[3] minimo = high[1] if (maximo-minimo > rangofvg) then if (fvg = 1) then drawrectangle(barindex[2], maximo, barindex + 1, minimo) coloured (255,0,0,32) bordercolor (255,102,102,0) if (maximo-minimo > rangosegmentosfvg) then drawsegment(barindex[2], maximo - (maximo - minimo) / 2, barindex + 1, maximo - (maximo - minimo) / 2) coloured (255,255,255,96) drawsegment(barindex[2], maximo - (maximo - minimo) / 4, barindex + 1, maximo - (maximo - minimo) / 4) coloured (255,255,255,96) drawsegment(barindex[2], minimo + (maximo - minimo) / 4, barindex + 1, minimo + (maximo - minimo) / 4) coloured (255,255,255,96) endif else // opening fvg drawrectangle(barindex[2], maximo, barindex + 10000, minimo) coloured (255,0,0,24) bordercolor (255,102,102,0) if (maximo-minimo > rangosegmentosfvg) then drawsegment(barindex[2], maximo - (maximo - minimo) / 2, barindex + 1, maximo - (maximo - minimo) / 2) coloured (255,255,255,96) drawsegment(barindex[2], maximo - (maximo - minimo) / 4, barindex + 1, maximo - (maximo - minimo) / 4) coloured (255,255,255,96) drawsegment(barindex[2], minimo + (maximo - minimo) / 4, barindex + 1, minimo + (maximo - minimo) / 4) coloured (255,255,255,96) endif endif if (maximo-minimo > 1.5 or maximo < 10000) then // dibuja también el siguiente en caso de ser muy pequeño, <10000 evita el SP500 fvg = 1 endif endif endif endif //// CLOSING LEVELS if drawclosinglevels then // linea en precio post-cierre a las 17.45 hora europea if (hour[1] = 17 and minute[1] = 45 + Mybarminutes) or (hour[1] = 18 and minute[1] = 0 and Mybarminutes = 15) then drawray(barindex[2], close[2], barindex[1], close[2]) coloured(0, 128, 0, 64) STYLE(dottedline3, 1) endif // linea en precio post-cierre a las 16.15 hora americana if (hour[1] = 22 and minute[1] = 15 + Mybarminutes) then drawray(barindex[2], close[2], barindex[1], close[2]) coloured(0, 0, 128, 64) STYLE(dottedline3, 1) endif endif endif return |
Share this
No information on this site is investment advice or a solicitation to buy or sell any financial instrument. Past performance is not indicative of future results. Trading may expose you to risk of loss greater than your deposits and is only suitable for experienced investors who have sufficient financial means to bear such risk.
ProRealTime ITF files and other attachments :PRC is also on YouTube, subscribe to our channel for exclusive content and tutorials


Great work!
¡gracias!
más capturas aqui:
https://www.prorealcode.com/wp-content/uploads/2024/10/ICT-captura-01.png
https://www.prorealcode.com/wp-content/uploads/2024/10/ICT-captura-02.png
https://www.prorealcode.com/wp-content/uploads/2024/10/ICT-variables.png
I had a go at the ‘order block’ version- badly done I’m sure….but a start.
// Sonarlabs – Order Block Finder
// converted from TradingView
// Lower the sensitivity to show more order blocks. A higher sensitivity will show less order blocks
defparam drawonlastbaronly=true
defparam calculateonlastbars=1000
//sens1 = 5
once obcreatedbear = 0
once obcreatedbull = 0
once crossindexbear = 0
once crossindexbull = 0
alcista = close[2] > open[2]
// —————–
OBBullMitigation = close[1]
OBBearMitigation = close[1]
if (alcista) then
maximo = low[1]
minimo = high[3]
if (maximo-minimo > rango) then
obcreatedbear = 1
crossindexbear = barindex
endif
else
maximo = low[3]
minimo = high[1]
if (maximo-minimo > rango) then
obcreatedbull = 1
crossindexbull = barindex
endif
endif
////////////////////////////////////////////////////////////////////////////////////////////////////////////////
// Calculation
////////////////////////////////////////////////////////////////////////////////////////////////////////////////
// ——————————-
// Bearish OB Creation
// ——————————-
// Check if we should create a OB. Also check if we haven’t created an OB in the last 5 candles.
if obcreatedbear and (crossindexbear – crossindexbear[1]) > 5 then
lastgreen = 0
hhighest = 0
// Loop through the most recent candles and find the first GREEN (Bullish) candle. We will place our OB here.
for i = 4 to 15
if close[i] > open[i] then
lastgreen = i
//populate the arrays of order block to draw them later
$left[plot]= barindex[lastgreen]
$top[plot]=high[lastgreen]
$bottom[plot]=low[lastgreen]
$right[plot]=barindex[lastgreen]
plot=plot+1 //increase the array column for next data
break
endif
next
endif
// ——————————-
// Bullish OB Creation
// ——————————-
// Check if we should create a OB, Also check if we haven’t created an OB in the last 5 candles.
if obcreatedbull and (crossindexbull – crossindexbull[1]) > 5 then
lastred = 0
hhighest = 0
// Loop through the most recent candles and find the first RED (Beaarish) candle. We will place our OB here.
for ibull = 4 to 15
if close[ibull] < open[ibull] then
lastred = ibull
//populate the arrays of order block to draw them later
$leftbull[plotbull]= barindex[lastred]
$topbull[plotbull]=high[lastred]
$bottombull[plotbull]=low[lastred]
$rightbull[plotbull]=barindex[lastred]
plotbull=plotbull+1 //increase the array column for next data
break
endif
next
endif
////////////////////////////////////////////////////////////////////////////////////////////////////////////////
// Cleanup
////////////////////////////////////////////////////////////////////////////////////////////////////////////////
// Clean up Bearish OB boxes
if plot>0 then
for j = plot-1 downto 0 //0 to plot-1
// If the two last closes are above the high of the bearish OB – Remove the OB
if $left[j]>0 then //check if the zone still exist
itop = $top[j]
breakout = summation[max(1,barindex-$left[j])](OBBearMitigation>itop)>=1 //2
if breakout then
$left[j]=0
endif
endif
next
endif
// Clean up Bullish OB boxes
if plotbull>0 then
for jbull = plotbull-1 downto 0 //0 to plotbull-1
// If the two last closes are below the low of the bullish OB – Remove the OB
if $leftbull[jbull]>0 then //check if the zone still exist
ibot = $bottombull[jbull]
breakoutbull = summation[max(1,barindex-$leftbull[jbull])](OBBullMitigation<ibot)>=1 //2
if breakoutbull then
$leftbull[jbull]=0
endif
endif
next
endif
////////////////////////////////////////////////////////////////////////////////////////////////////////////////
// Drawing
////////////////////////////////////////////////////////////////////////////////////////////////////////////////
//fade=0
if islastbarupdate then
//plot the Bearish boxes
if plot>0 then //islastbarupdate and
for j = plot-1 downto 0 //0 to plot-1
if $left[j]>0 then
drawrectangle($left[j],$top[j],barindex,$bottom[j]) coloured(“red”,fade)bordercolor(“red”,fade+50) //bordercolor(“green”,85) //coloured(80,108,211,50) bordercolor(80,108,211,50)
endif
next
endif
//plot the Bullish boxes
if plotbull>0 then //islastbarupdate and
for jbull = plotbull-1 downto 0 //0 to plotbull-1
if $leftbull[jbull]>0 then
drawrectangle($leftbull[jbull],$bottombull[jbull],barindex,$topbull[jbull]) coloured(“green”,fade)bordercolor(“green”,fade+50)//bordercolor(“red”,85) //coloured(100,196,172,50) bordercolor(100,196,172,50)
//drawrectangle(barindex, $bottombull[jbull],$leftbull[jbull],$topbull[jbull]) coloured(“red”,85)//bordercolor(“red”,85) //coloured(100,196,172,50) bordercolor(100,196,172,50)
endif
next
endif
endif
return
take ”sens1 = 5” out and put ”rango” in as variable