

ICT Killzones and Pivots: Time Zones and Pivots
Introduction
The ICT Killzones and Pivots indicator is a tool designed to help traders identify key time zones in financial markets, known as Killzones. These zones correspond to the most active sessions in global markets, such as the Asian, London, and New York sessions. During these periods, markets tend to show higher volume and volatility, which can provide unique trading opportunities.
In addition to marking the time zones, the indicator plots important pivots within each of these sessions. The pivots are generated based on the highs and lows reached during each Killzone, providing critical reference points for making informed trading decisions.
This indicator is ideal for traders operating in timeframes of 1 hour or less. If a higher timeframe is selected, the indicator will display a warning message asking the user to adjust to an appropriate timeframe to ensure proper functioning.
Indicator Objective
The main objective of the ICT Killzones and Pivots is to highlight the time zones where markets tend to have higher activity and volatility. These zones, known as Killzones, are key to identifying possible trend changes, price breakouts, or important consolidations in the market.
Each Killzone is associated with one of the main global financial market sessions: Asia, London, and New York. Within each session, the indicator identifies and marks the highs and lows reached, providing reference levels that can act as dynamic support and resistance.
In addition to the Killzones, the indicator also plots pivots based on price crossings with the high or low levels of previous sessions. These pivots can be used to validate breakouts, consolidations, or trend reversals, offering traders valuable information for making more precise decisions.
The ICT Killzones and Pivots is specifically designed for traders who operate in intraday or short-term timeframes, as its accuracy depends on the correct identification of key levels in timeframes of 1 hour or less.
Explanation of Time Zones (Killzones)
The ICT Killzones and Pivots indicator divides the market into three main time zones, or Killzones, each corresponding to a key session of the global markets: Asia, London, and New York. These Killzones help identify periods of greater volatility in each session by highlighting the highs and lows reached within these timeframes.
Below is a description of each zone and how it functions:
- Asia (ASIA Zone):
- Operating Hours: from 02:00 to 06:00.
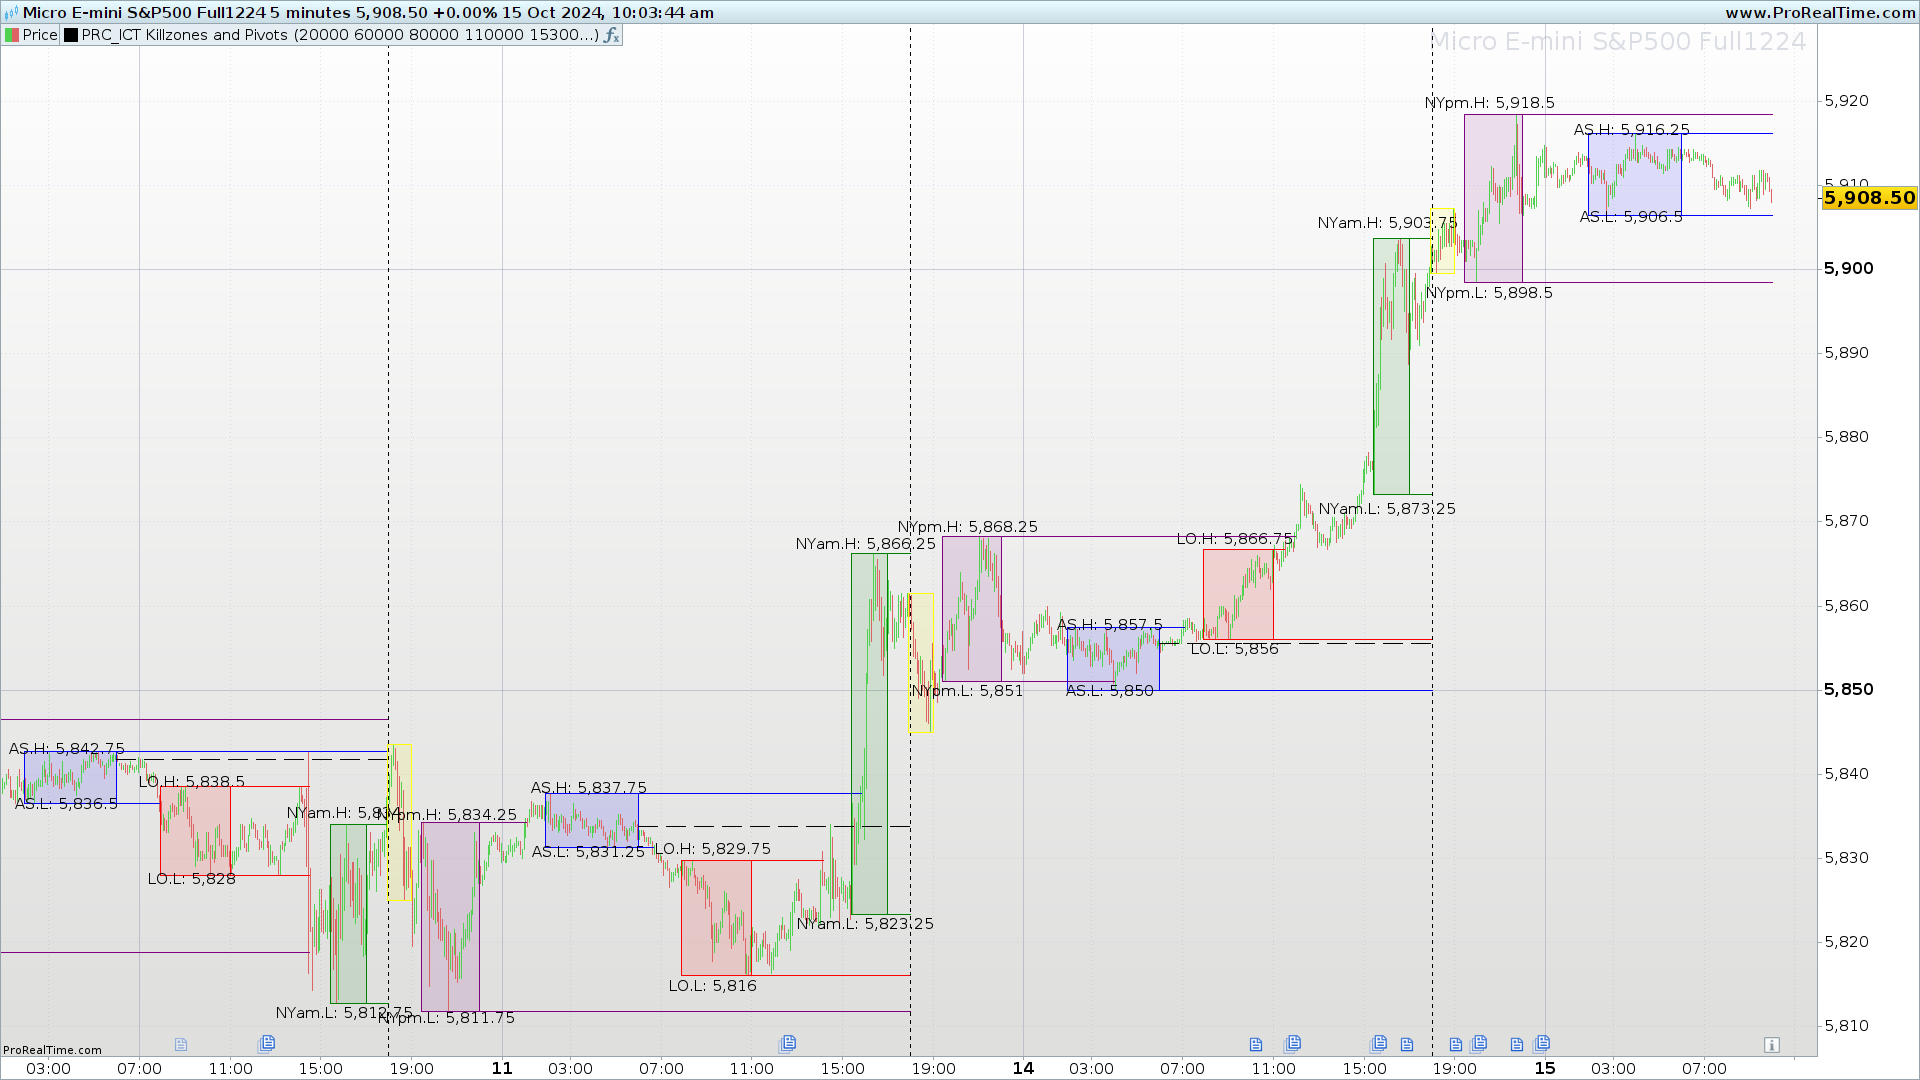
- Description: The Asian session is the first Killzone highlighted by the indicator. During this time window, the highs and lows of the price reached between 02:00 and 06:00 are plotted. These levels serve as reference points that can act as support or resistance zones for future price movements. The levels are displayed on the chart with a blue rectangle.
- London (London Open Zone):
- Operating Hours: from 08:00 to 11:00.
- Description: This Killzone marks the opening of the London session, one of the most important due to its high trading volume. The indicator plots the highs and lows of the price during this session, highlighting them with a red rectangle. These levels can indicate important confluence areas for traders who operate breakouts or consolidations.
- New York (New York Zones):
- New York AM: from 15:30 to 17:00.
- New York Lunch: from 18:00 to 19:00.
- New York PM: from 19:30 to 22:00.
- Description: The New York session is divided into three parts: the morning session (AM), the lunch hour (Lunch), and the afternoon session (PM). Each of these subzones allows for more precise identification of critical points in each segment of the American session. The levels of these zones are highlighted on the chart with rectangles of different colors: green for the AM session, yellow for the Lunch session, and purple for the PM session.
These Killzones provide a clear visual framework for traders who seek to trade based on the opening and closing phases of the most important sessions in the global market. Identifying the highs and lows within each Killzone can provide valuable opportunities for strategies based on breakouts, consolidations, or trend reversals.
Recommended Timeframe
The ICT Killzones and Pivots is designed to be used in timeframes of 1 hour or less. If a higher timeframe is selected, the indicator will display a warning message to inform the user that they need to adjust the timeframe for the indicator to properly show the Killzones.
Indicator Functionality
The ICT Killzones and Pivots uses a series of key features to mark the time zones and critical levels within these sessions:
- High and low zones: Each Killzone plots the highs and lows of the price during the corresponding session. These levels are drawn as rectangles of different colors according to the session (blue for Asia, red for London, green for New York AM, yellow for New York Lunch, and purple for New York PM).
- Segments and pivots: When the price crosses the previous high or low levels of a session, lines are drawn to highlight these pivots. These lines act as dynamic support and resistance during the current session, providing entry or exit points depending on market conditions.
- Day limits and reset: The indicator automatically resets at the start of each new trading day or at the close of the American session, ensuring that the plotted price levels are accurate and up-to-date for the new trading day.
Indicator Customization
The ICT Killzones and Pivots is highly customizable, allowing traders to adjust several parameters according to their needs. The customization options include:
- Opening and closing hours of sessions: The indicator allows modification of the opening and closing hours of the Asian, London, and New York sessions. These times can be adjusted to match local trading hours or according to the trader’s preferences.
- Display of the New York lunch session: Through the
ShowNylchparameter, it is possible to enable or disable the display of the New York lunch session, allowing for greater control over the zones to be highlighted on the chart.
Indicator Usage
The ICT Killzones and Pivots is especially useful for traders who want to operate during the most volatile sessions of the market. Identifying the highs and lows within each Killzone can serve as a reference for making decisions based on:
- Price breakouts: Trading based on price breakouts when it crosses the pivot levels generated by the indicator.
- Trend reversals: Taking advantage of possible market turns at key levels, where the price may reverse after reaching significant support or resistance.
Suggested Strategies
- Pivot Breakouts: Traders can trade breakouts when the price crosses the pivot levels marked in each Killzone. This strategy is especially useful during session openings, where volume tends to increase.
- Reversals at extremes: The highs and lows of the Killzones often act as important support and resistance areas, making it easier to identify potential reversals or consolidations at these levels.
Configuration in ProRealTime
Below is the source code for the indicator in ProRealTime, ready for use and customization. The schedules and colors of the zones can be modified directly from the configurable variables at the top of the code.
//----------------------------------------------//
//PRC_ICT Killzones and Pivots
//version = 0
//10.10.2024
//Iván González @ www.prorealcode.com
//Sharing ProRealTime knowledge
//----------------------------------------------//
//-----INPUTS-----------------------------------//
//----------------------------------------------//
openAS=020000
closeAS=060000
openLO=080000
closeLO=110000
openNYam=153000
closeNYam=170000
openNYlch=180000
closeNYlch=190000
openNYpm=193000
closeNYpm=220000
openNY=openNYam
closeNY=closeNYpm
limitday=180000
openTrueDay=060000

ShowNylch=1

if gettimeframe<=3600 then
//----------------------------------------------//
//-----ASIA Zone--------------------------------//
//----------------------------------------------//
once maxHighAS=high
once minLowAS=low
if opentime>=openAS and opentime<=closeAS then
barAS=barAS+1
if high>=maxHighAS then
maxHighAS=high
else
maxHighAS=maxHighAS
endif
if low<=minLowAS then
minLowAS=low
else
minLowAS=minLowAS
endif
endif
if opentime=closeAS then
drawrectangle(barindex[barAS],minLowAS,barindex,maxHighAS)coloured("blue")fillcolor("blue",30)
drawtext("AS.H: #maxHighAS#",barindex[round(barAS/2)],maxHighAS+0.3*tr)
drawtext("AS.L: #minLowAS#",barindex[round(barAS/2)],minLowAS-0.3*tr)
prevLowAS=minLowAS
prevHighAS=maxHighAS
previdxAS=barindex
barAS=0
minLowAS=high*100
maxHighAS=0
endif
if low crosses under prevLowAS then
drawsegment(previdxAS,prevLowAS,barindex,prevLowAS)coloured("blue")
prevLowAS=0
elsif opentime=limitday and prevLowAS<>0 then
drawsegment(previdxAS,prevLowAS,barindex,prevLowAS)coloured("blue")
prevLowAS=0
elsif islastbarupdate and prevLowAS<>0 then
drawsegment(previdxAS,prevLowAS,barindex,prevLowAS)coloured("blue")
endif
if high crosses over prevHighAS then
drawsegment(previdxAS,prevHighAS,barindex,prevHighAS)coloured("blue")
prevHighAS=0
elsif opentime=limitday and prevHighAS<>0 then
drawsegment(previdxAS,prevHighAS,barindex,prevHighAS)coloured("blue")
prevHighAS=0
elsif islastbarupdate and prevHighAS<>0 then
drawsegment(previdxAS,prevHighAS,barindex,prevHighAS)coloured("blue")
endif
//----------------------------------------------//
//-----London Zone------------------------------//
//----------------------------------------------//
once maxHighLO=high
once minLowLO=low
if opentime>=openLO and opentime<=closeLO then
barLO=barLO+1
if high>=maxHighLO then
maxHighLO=high
else
maxHighLO=maxHighLO
endif
if low<=minLowLO then
minLowLO=low
else
minLowLO=minLowLO
endif
endif
if opentime=closeLO then
drawrectangle(barindex[barLO],minLowLO,barindex,maxHighLO)coloured("red")fillcolor("red",30)
drawtext("LO.H: #maxHighLO#",barindex[round(barLO/2)],maxHighLO+0.3*tr)
drawtext("LO.L: #minLowLO#",barindex[round(barLO/2)],minLowLO-0.3*tr)
prevLowLO=minLowLO
prevHighLO=maxHighLO
previdxLO=barindex
barLO=0
minLowLO=high*100
maxHighLO=0
endif
if low crosses under prevLowLO then
drawsegment(previdxLO,prevLowLO,barindex,prevLowLO)coloured("red")
prevLowLO=0
elsif opentime=limitday and prevLowLO<>0 then
drawsegment(previdxLO,prevLowLO,barindex,prevLowLO)coloured("red")
prevLowLO=0
elsif islastbarupdate and prevLowLO<>0 then
drawsegment(previdxLO,prevLowLO,barindex,prevLowLO)coloured("red")
endif
if high crosses over prevHighLO then
drawsegment(previdxLO,prevHighLO,barindex,prevHighLO)coloured("red")
prevHighLO=0
elsif opentime=limitday and prevHighLO<>0 then
drawsegment(previdxLO,prevHighLO,barindex,prevHighLO)coloured("red")
prevHighLO=0
elsif islastbarupdate and prevHighLO<>0 then
drawsegment(previdxLO,prevHighLO,barindex,prevHighLO)coloured("red")
endif
if ShowNylch then
//----------------------------------------------//
//-----New York AM------------------------------//
//----------------------------------------------//
once maxHighNYam=high
once minLowNYam=low
if opentime>=openNYam and opentime<=closeNYam then
barNYam=barNYam+1
if high>=maxHighNYam then
maxHighNYam=high
else
maxHighNYam=maxHighNYam
endif
if low<=minLowNYam then
minLowNYam=low
else
minLowNYam=minLowNYam
endif
endif
if opentime=closeNYam then
drawrectangle(barindex[barNYam],minLowNYam,barindex,maxHighNYam)coloured("green")fillcolor("green",30)
drawtext("NYam.H:
#maxHighNYam#",barindex[round(barNYam/2)],maxHighNYam+0.3*tr)
drawtext("NYam.L:
#minLowNYam#",barindex[round(barNYam/2)],minLowNYam-0.3*tr)
prevLowNYam=minLowNYam
prevHighNYam=maxHighNYam
previdxNYam=barindex
barNYam=0
minLowNYam=high*100
maxHighNYam=0
endif
if low crosses under prevLowNYam then
drawsegment(previdxNYam,prevLowNYam,barindex,prevLowNYam)coloured("green")
prevLowNYam=0
elsif opentime=limitday and prevLowNYam<>0 then
drawsegment(previdxNYam,prevLowNYam,barindex,prevLowNYam)coloured("green")
prevLowNYam=0
elsif islastbarupdate and prevLowNYam<>0 then
drawsegment(previdxNYam,prevLowNYam,barindex,prevLowNYam)coloured("green")
endif
if high crosses over prevHighNYam then
drawsegment(previdxNYam,prevHighNYam,barindex,prevHighNYam)coloured("green")
prevHighNYam=0
elsif opentime=limitday and prevHighNYam<>0 then
drawsegment(previdxNYam,prevHighNYam,barindex,prevHighNYam)coloured("green")
prevHighNYam=0
elsif islastbarupdate and prevHighNYam<>0 then
drawsegment(previdxNYam,prevHighNYam,barindex,prevHighNYam)coloured("green")
endif
//----------------------------------------------//
//-----New York lunch Zone----------------------//
//----------------------------------------------//
once maxHighNYlch=high
once minLowNYlch=low
if opentime>=openNYlch and opentime<=closeNYlch then
barNYlch=barNYlch+1
if high>=maxHighNYlch then
maxHighNYlch=high
else
maxHighNYlch=maxHighNYlch
endif
if low<=minLowNYlch then
minLowNYlch=low
else
minLowNYlch=minLowNYlch
endif
endif
if opentime=closeNYlch then
drawrectangle(barindex[barNYlch],minLowNYlch,barindex,maxHighNYlch)coloured("yellow")fillcolor("yellow",30)
prevLowNYlch=minLowNYlch
prevHighNYlch=maxHighNYlch
previdxNYlch=barindex
barNYlch=0
minLowNYlch=high*100
maxHighNYlch=0
endif
//----------------------------------------------//
//-----New York PM -----------------------------//
//----------------------------------------------//
once maxHighNYpm=high
once minLowNYpm=low
if opentime>=openNYpm and opentime<=closeNYpm then
barNYpm=barNYpm+1
if high>=maxHighNYpm then
maxHighNYpm=high
else
maxHighNYpm=maxHighNYpm
endif
if low<=minLowNYpm then
minLowNYpm=low
else
minLowNYpm=minLowNYpm
endif
endif
if opentime=closeNYpm then
drawrectangle(barindex[barNYpm],minLowNYpm,barindex,maxHighNYpm)coloured("purple")fillcolor("purple",30)
drawtext("NYpm.H:
#maxHighNYpm#",barindex[round(barNYpm/2)],maxHighNYpm+0.3*tr)
drawtext("NYpm.L:
#minLowNYpm#",barindex[round(barNYpm/2)],minLowNYpm-0.3*tr)
prevLowNYpm=minLowNYpm
prevHighNYpm=maxHighNYpm
previdxNYpm=barindex
barNYpm=0
minLowNYpm=high*100
maxHighNYpm=0
endif
if low crosses under prevLowNYpm then
drawsegment(previdxNYpm,prevLowNYpm,barindex,prevLowNYpm)coloured("purple")
prevLowNYpm=0
elsif opentime=limitday and prevLowNYpm<>0 then
drawsegment(previdxNYpm,prevLowNYpm,barindex,prevLowNYpm)coloured("purple")
prevLowNYpm=0
elsif islastbarupdate and prevLowNYpm<>0 then
drawsegment(previdxNYpm,prevLowNYpm,barindex,prevLowNYpm)coloured("purple")
endif
if high crosses over prevHighNYpm then
drawsegment(previdxNYpm,prevHighNYpm,barindex,prevHighNYpm)coloured("purple")
prevHighNYpm=0
elsif opentime=limitday and prevHighNYpm<>0 then
drawsegment(previdxNYpm,prevHighNYpm,barindex,prevHighNYpm)coloured("purple")
prevHighNYpm=0
elsif islastbarupdate and prevHighNYpm<>0 then
drawsegment(previdxNYpm,prevHighNYpm,barindex,prevHighNYpm)coloured("purple")
endif
else
once maxHighNY=high
once minLowNY=low
if opentime>=openNY and opentime<=closeNY then
barNY=barNY+1
if high>=maxHighNY then
maxHighNY=high
else
maxHighNY=maxHighNY
endif
if low<=minLowNY then
minLowNY=low
else
minLowNY=minLowNY
endif
endif
if opentime=closeNY then
drawrectangle(barindex[barNY],minLowNY,barindex,maxHighNY)coloured("purple")fillcolor("purple",30)
drawtext("NY.H: #maxHighNY#",barindex[round(barNY/2)],maxHighNY+0.3*tr)
drawtext("NY.L: #minLowNY#",barindex[round(barNY/2)],minLowNY-0.3*tr)
prevLowNY=minLowNY
prevHighNY=maxHighNY
previdxNY=barindex
barNY=0
minLowNY=high*100
maxHighNY=0
endif
if low crosses under prevLowNY then
drawsegment(previdxNY,prevLowNY,barindex,prevLowNY)coloured("purple")
prevLowNY=0
elsif opentime=limitday and prevLowNY<>0 then
drawsegment(previdxNY,prevLowNY,barindex,prevLowNY)coloured("purple")
prevLowNY=0
elsif islastbarupdate and prevLowNY<>0 then
drawsegment(previdxNY,prevLowNY,barindex,prevLowNY)coloured("purple")
endif
if high crosses over prevHighNY then
drawsegment(previdxNY,prevHighNY,barindex,prevHighNY)coloured("purple")
prevHighNY=0
elsif opentime=limitday and prevHighNY<>0 then
drawsegment(previdxNY,prevHighNY,barindex,prevHighNY)coloured("purple")
prevHighNY=0
elsif islastbarupdate and prevHighNY<>0 then
drawsegment(previdxNY,prevHighNY,barindex,prevHighNY)coloured("purple")
endif
endif
//----------------------------------------------//
//-----Limit Day--------------------------------//
//----------------------------------------------//
if opentime=openTrueDay then
openTD=open
barTD=barindex
else
if opentime=limitday then
drawvline(barindex)style(dottedline)
drawsegment(barTD,openTD,barindex,openTD)style(dottedline1)
endif
endif
else
drawtext("Change timeframe to 1hr or
less",0,0,SansSerif,bold,34)anchor(middle,xshift,yshift)
endif
return
Conclusion
The ICT Killzones and Pivots is a powerful visual tool designed for traders who want to take advantage of market movements within the main time zones of the Asian, London, and New York sessions. Thanks to its customization capabilities and the clarity of the levels generated, this indicator is ideal for both intraday strategies and traders who prefer to operate during specific sessions of the day.
