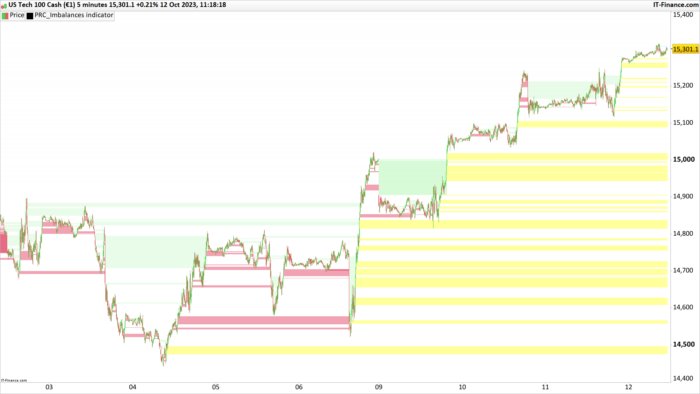
This code helps to visually identify and highlight certain “imbalances” in the price movement of an asset (like a stock or currency). Think of “imbalance” as sudden surges or drops in the asset’s price that can create potential buying or selling opportunities.
Here’s how it works:
- **Setting Up**:
–defparam drawonlastbaronly=true: This means the indicator will only execute its calculations and drawings on the most recent data point or “bar” of the chart. - . **Identifying Support**:- If the high price from 2 bars ago is less than the current low price, it’s considered a potential support level (a price level where the asset might stop falling and start rising). – This level is stored in a list for future reference.
- **Identifying Resistance**: – If the current high price is less than the low price from 2 bars ago, it’s considered a potential resistance level (a price level where the asset might stop rising and start falling). – This level is also stored in a list for future reference.
- **Checking and Drawing Support Imbalances**: – For each identified potential support level, the code checks if the price ever fell below this level afterward. – If it did, a yellow rectangle is drawn from the bar where this support was identified to the bar where the price broke below this support. – If the price hasn’t gone below this support yet, the rectangle is drawn up to the most recent bar.
- **Checking and Drawing Resistance Imbalances**: – Similarly, for each potential resistance level, the code checks if the price ever rose above this level. – If it did, a cyan rectangle is drawn from the bar where this resistance was identified to the bar where the price broke above this resistance. – If the price hasn’t gone above this resistance yet, the rectangle is drawn up to the most recent bar.
In simpler terms:
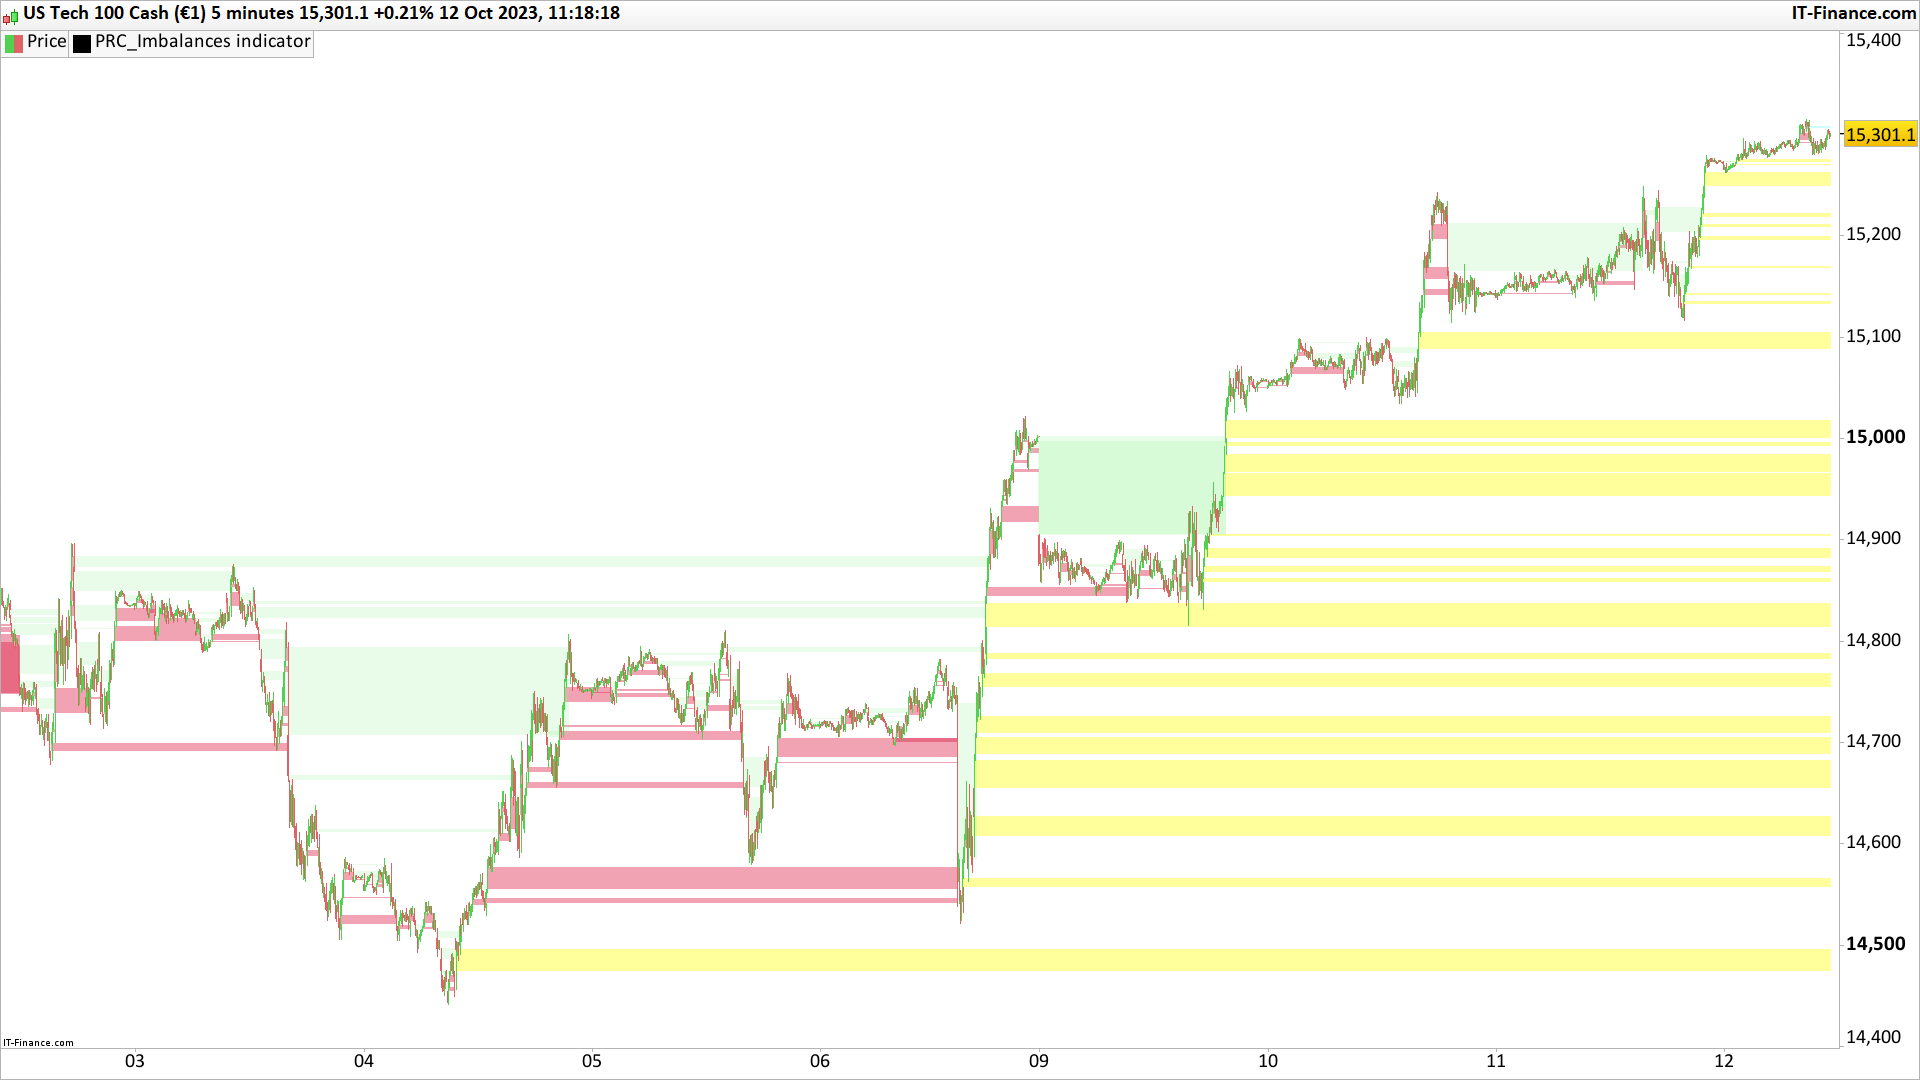
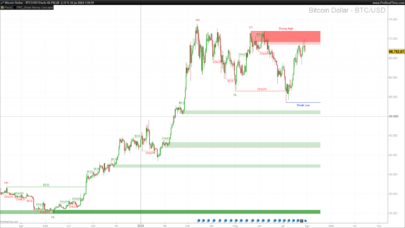
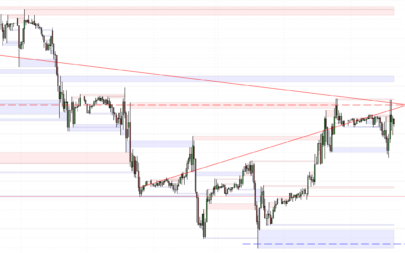
This code visually highlights areas where there was a sudden change in the price movement, creating potential buying or selling opportunities. Yellow rectangles show where the price suddenly dropped, suggesting potential buying zones that are not filled (filled areas are in light green). Cyan rectangles show where the price surged, suggesting potential selling zones that are not filled yet (filled areas are in red). The rectangles help traders quickly spot these opportunities on their charts.
|
1 2 3 4 5 6 7 8 9 10 11 12 13 14 15 16 17 18 19 20 21 22 23 24 25 26 27 28 29 30 31 32 33 34 35 36 37 38 39 40 41 42 43 44 45 46 47 48 49 50 51 52 53 54 55 56 57 58 59 60 61 62 |
//PRC_Imbalances indicator //12.10.2023 //Nicolas @ www.prorealcode.com //Sharing ProRealTime knowledge defparam drawonlastbaronly=true REM Store support IF high[2] < low THEN $support[i]= high[2] $bar[i]=barindex i=i+1 ENDIF REM Store resistance if high<low[2] then $res[y]= low[2] $resbar[y]=barindex y=y+1 endif REM check support line if islastbarupdate and i>1 then for j = i-1 downto 0 checklow = $support[j] bars = max(1,barindex-$bar[j]) endbar=barindex for z = bars downto 1 if low[z]<checklow then endbar=barindex[z] break endif next if endbar<barindex then drawrectangle($bar[j]-2,low[max(0,barindex-$bar[j])],endbar,$support[j]) coloured("crimson",50) bordercolor(0,0,0,0) ELSE drawrectangle($bar[j]-2,low[max(0,barindex-$bar[j])],barindex,$support[j]) coloured("yellow",50) bordercolor(0,0,0,0) endif next endif REM check resistance line if islastbarupdate and y>1 then for j = y-1 downto 0 checkhigh = $res[j] bars = max(1,barindex-$resbar[j]) endbar=barindex for z = bars downto 1 if high[z]>checkhigh then endbar=barindex[z] break endif next if endbar<barindex then drawrectangle($resbar[j]-2,high[max(0,barindex-$resbar[j])],endbar,$res[j]) coloured("lightgreen",50) bordercolor(0,0,0,0) ELSE drawrectangle($resbar[j]-2,high[max(0,barindex-$resbar[j])],barindex,$res[j]) coloured("cyan",50) bordercolor(0,0,0,0) endif next endif RETURN |
Share this
No information on this site is investment advice or a solicitation to buy or sell any financial instrument. Past performance is not indicative of future results. Trading may expose you to risk of loss greater than your deposits and is only suitable for experienced investors who have sufficient financial means to bear such risk.
ProRealTime ITF files and other attachments :PRC is also on YouTube, subscribe to our channel for exclusive content and tutorials

Bonjour Nicolas,
Ce que je ne comprends pas c’est dans ton code il n’y a que deux couleurs, je ne vois pas le rouge
C’est juste, désolé j’ai corrigé ! 🙂
Merci!
Merci Nicolas.
Bonjour Nicolas
Super indicator. Juste une question les couleurs sont a l’inverse de l’explication en ce qui me concerne.
Jaune = sudden surge in price
cyan (bleu) = sudden drop in price
Je ne vois pas comment je puisse ajouter une image ??
Merci en tout cas
Hi Nicolas, thank you for this very interesting code. There is something I don’t get though (and I just edited my post of 1 hour ago): On my chart I can only see the yellow rectangles for price support, but never the cyan rectangles for resistance zone. Looking at your example chart above, it’s the same: no cyan rectangles. How comes? EDIT: Sorry to bother, seems to be going well now…all fine!
probleme code : message veuillez definir alpha futur nbO X X1Y y1
Bjr Nicolas , pour exemple cet indicateur est extrêmement bien développé chez trading view & très complet et reflète parfaitement la méthode ICT
Cordialement
//This source code is subject to the terms of the Mozilla Public License 2.0 at https://mozilla.org/MPL/2.0/
indicator(‘Super OrderBlock / FVG / BoS Tools by makuchaku & eFe’, overlay=true, max_boxes_count=500, max_lines_count=500)
plotOB = input.bool(defval=true, title=’Plot OB’, group=’Order Blocks’)
obBullColor = input.color(defval=color.new(color.green, 90), title=’Bullish OB Color’, inline=’Set Custom Color’, group=’Order Blocks’)
obBearColor = input.color(defval=color.new(color.red, 90), title=’Bearish OB Color’, inline=’Set Custom Color’, group=’Order Blocks’)
obBoxBorder = input.string(defval=line.style_solid, title=’OB Box Border Style’, options=[line.style_dashed, line.style_dotted, line.style_solid], group=’Order Blocks’, tooltip=’To disable border, set Border Width below to 0′)
obBorderTransparency = input.int(defval=80, title=’OB Border Box Transparency’, minval=0, maxval=100, group=’Order Blocks’)
obMaxBoxSet = input.int(defval=10, title=’Maximum OB Box Displayed’, minval=1, maxval=100, group=’Order Blocks’, tooltip=’Minimum = 1, Maximum = 100′)
filterMitOB = input.bool(defval=false, title=’Custom Color Mitigated OB’, group=’Order Blocks’)
mitOBColor = input.color(defval=color.new(color.gray, 90), title=’Mitigated OB Color’, group=’Order Blocks’, inline=’Set Custom Color Mit OB’, tooltip=’Set Transparency to 0 to make mitigated OB disappear’)
plotFVG = input.bool(defval=true, title=’Plot FVG’, group=’Fair Value Gaps’, inline=’FVG sets’)
plotStructureBreakingFVG = input.bool(defval=true, title=’Plot Structure Breaking FVG’, group=’Fair Value Gaps’, inline=’FVG sets’)
fvgBullColor = input.color(defval=color.new(color.black, 90), title=’Bullish FVG Color’, inline=’Set Custom Color’, group=’Fair Value Gaps’)
fvgBearColor = input.color(defval=color.new(color.black, 90), title=’Bearish FVG Color’, inline=’Set Custom Color’, group=’Fair Value Gaps’)
fvgStructBreakingColor = input.color(defval=color.new(color.blue, 90), title=’Structure Breaking FVG Color’, inline=’Set Custom Color’, group=’Fair Value Gaps’)
fvgBoxBorder = input.string(defval=line.style_solid, title=’FVG Box Border Style’, options=[line.style_dashed, line.style_dotted, line.style_solid], group=’Fair Value Gaps’, tooltip=’To disable border, set Border Width below to 0′)
fvgBorderTransparency = input.int(defval=80, title=’FVG Border Box Transparency’, minval=0, maxval=100, group=’Fair Value Gaps’)
fvgMaxBoxSet = input.int(defval=10, title=’Maximum FVG Box Displayed’, minval=1, maxval=100, group=’Fair Value Gaps’, tooltip=’Minimum = 1, Maximum = 100′)
filterMitFVG = input.bool(defval=false, title=’Custom Color Mitigated FVG’, group=’Fair Value Gaps’)
mitFVGColor = input.color(defval=color.new(color.gray, 90), title=’Mitigated FVG Color’, group=’Fair Value Gaps’, inline=’Set Custom Color Mit FVG’, tooltip=’Set Transparency to 0 to make mitigated FVG disappear’)
plotRJB = input.bool(defval=false, title=’Plot RJB’, group=’Rejection Blocks’, inline=’RJB sets’)
rjbBullColor = input.color(defval=color.new(color.green, 90), title=’Bullish RJB Color’, inline=’Set Custom Color’, group=’Rejection Blocks’)
rjbBearColor = input.color(defval=color.new(color.red, 90), title=’Bearish RJB Color’, inline=’Set Custom Color’, group=’Rejection Blocks’)
rjbBoxBorder = input.string(defval=line.style_solid, title=’RJB Box Border Style’, options=[line.style_dashed, line.style_dotted, line.style_solid], group=’Rejection Blocks’, tooltip=’To disable border, set Border Width below to 0′)
rjbBorderTransparency = input.int(defval=80, title=’RJB Border Box Transparency’, minval=0, maxval=100, group=’Rejection Blocks’)
rjbMaxBoxSet = input.int(defval=10, title=’Maximum RJB Box Displayed’, minval=1, maxval=100, group=’Rejection Blocks’, tooltip=’Minimum = 1, Maximum = 100′)
filterMitRJB = input.bool(defval=false, title=’Custom Color Mitigated RJB’, group=’Rejection Blocks’)
mitRJBColor = input.color(defval=color.new(color.gray, 90), title=’Mitigated RJB Color’, group=’Rejection Blocks’, inline=’Set Custom Color Mit RJB’, tooltip=’Set to 100 to make mitigated RJB disappear’)
plotPVT = input.bool(defval=true, title=’Plot Pivots’, group=’Pivots’)
pivotLookup = input.int(defval=1, minval=1, maxval=5,title=’Pivot Lookup’, group=’Pivots’, tooltip=’Minimum = 1, Maximum = 5′)
pvtTopColor = input.color(defval=color.new(color.silver, 0), title=’Pivot Top Color’, group=’Pivots’, inline=’PVT Color’)
pvtBottomColor = input.color(defval=color.new(color.silver, 0), title=’Pivot Bottom Color’, group=’Pivots’, inline=’PVT Color’)
plotBOS = input.bool(defval=false, title=’Plot BoS’, group=’Crossovers’, inline=’BOS sets’)
useHighLowForBullishBoS = input.bool(defval=false, title=’Use High/Low for Bullish BoS (for Bearish setup)’, group=’Crossovers’)
useHighLowForBearishBoS = input.bool(defval=false, title=’Use High/Low for Bearish BoS (for Bullish setup)’, group=’Crossovers’)
bosBoxFlag = input.bool(title=’BoS Box Length Manually’, defval=false, group=’Crossovers’, tooltip=’If activated the BoS Boxes will not extend unitl crossed by price. Instead will extend by the amount of bars choosen in the “Set BoS Box Length Manually” option’)
bosBoxLength = input.int(title=’BoS Box Length Manually’, defval=3, minval=1, maxval=5, group=’Crossovers’, inline=’BoS Boxes’, tooltip=’If “Set BoS Box Length Manually” is marked, choose by how many bars. Minimum = 1, Maximum = 5′)
bosBullColor = input.color(defval=color.new(color.green, 90), title=’Bullish BoS Color’, inline=’Set Custom Color’, group=’Crossovers’)
bosBearColor = input.color(defval=color.new(color.red, 90), title=’Bearish BoS Color’, inline=’Set Custom Color’, group=’Crossovers’)
bosBoxBorder = input.string(defval=line.style_solid, title=’BoS Box Border Style’, options=[line.style_dashed, line.style_dotted, line.style_solid], group=’Crossovers’, tooltip=’To disable border, set Border Width below to 0′)
bosBorderTransparency = input.int(defval=80, title=’BoS Border Box Transparency’, minval=0, maxval=100, group=’Crossovers’)
bosMaxBoxSet = input.int(defval=10, title=’Maximum BoS Box Displayed’, minval=1, maxval=100, group=’Crossovers’, tooltip=’Minimum = 1, Maximum = 100′)
plotHVB = input.bool(defval=true, title=’Plot HVB’, group=’High Volume Bar’, tooltip=’A candle where the average volume is higher than last few bars.’)
hvbBullColor = input.color(defval=color.green, title=’Bullish HVB Color’, inline=’Set Custom Color’, group=’High Volume Bar’)
hvbBearColor = input.color(defval=color.red, title=’Bearish HVB Color’, inline=’Set Custom Color’, group=’High Volume Bar’)
hvbEMAPeriod = input.int(defval=12, minval=1, title=’Volume EMA Period’, group=’High Volume Bar’)
hvbMultiplier = input.float(defval=1.5, title=’Volume Multiplier’, minval=1, maxval=100, group=’High Volume Bar’)
plotPPDD = input.bool(defval=true, title=”Plot PPDD OB’s”, group=’Qualitative indicators’, tooltip=’Premium Premium Discount Discount (PPDD) is an OB formed after liquidity sweep. It will show up by default as a triangle (Bull ▲ / Bear ▼). Also PPDD1 (by deafult maked with a x-cross ⨯) which is a weak OB formed after liquidity sweep, that fails to completely engulf the high/low, but closes beyond the trapped candles open price.’)
ppddBullColor = input.color(defval=color.new(color.green, 0), title=”Bullish PPDD OB’s Color”, group=’Qualitative indicators’, inline=’PPDD Color’)
ppddBearColor = input.color(defval=color.new(color.red, 0), title=”Bearish PPDD OB’s Color”, group=’Qualitative indicators’, inline=’PPDD Color’)
plotOBFVG = input.bool(defval=true, title=’Plot Stacked OB+FVG’, group=’Qualitative indicators’, tooltip=’Marks the candle (default with a diamond ◆) when an OB & FVG are stacked, showing momentum’)
obfvgBullColor = input.color(defval=color.new(color.green, 0), title=’Bullish Stacked OB+FVG Color’, group=’Qualitative indicators’, inline=’OBFVG Color’)
obfvgBearColor = input.color(defval=color.new(color.red, 0), title=’Bearish Stacked OB+FVG Color’, group=’Qualitative indicators’, inline=’OBFVG Color’)
plotLabelOB = input.bool(defval=true, title=’Plot OB Label’, inline=’OB label’, group=’Label Options’)
obLabelColor = input.color(defval=color.gray, title=’Color’, inline=’OB label’, group=’Label Options’)
obLabelSize = input.string(defval=size.tiny, title=”Size”, options=[size.huge, size.large, size.small, size.tiny, size.auto, size.normal], inline=’OB label’, group=’Label Options’)
plotLabelFVG = input.bool(defval=true, title=’Plot FVG Label’, inline=’FVG label’, group=’Label Options’)
fvgLabelColor = input.color(defval=color.gray, title=’Color’, inline=’FVG label’, group=’Label Options’)
fvgLabelSize = input.string(defval=size.tiny, title=”Size”, options=[size.huge, size.large, size.small, size.tiny, size.auto, size.normal], inline=’FVG label’, group=’Label Options’)
plotLabelRJB = input.bool(defval=true, title=’Plot RJB Label’, inline=’RJB label’, group=’Label Options’)
rjbLabelColor = input.color(defval=color.gray, title=’Color’, inline=’RJB label’, group=’Label Options’)
rjbLabelSize = input.string(defval=size.tiny, title=”Size”, options=[size.huge, size.large, size.small, size.tiny, size.auto, size.normal], inline=’RJB label’, group=’Label Options’)
plotLabelBOS = input.bool(defval=true, title=’Plot BoS Label’, inline=’BOS label’, group=’Label Options’)
bosLabelColor = input.color(defval=color.gray, title=’Color’, inline=’BOS label’, group=’Label Options’)
bosLabelSize = input.string(defval=size.tiny, title=”Size”, options=[size.huge, size.large, size.small, size.tiny, size.auto, size.normal], inline=’BOS label’, group=’Label Options’)
//Box Types
var int _ob = 1
var int _fvg = 2
var int _rjb = 3
var int _bos = 4
//Box Labels
var string _obLabel = “OB”
var string _fvgLabel = “FVG”
var string _rjbLabel = “RJB”
var string _bosLabel = “BoS”
var string _plus = “+”
var string _minus = “-”
var string _empty = “”
//Box Arrays
var box[] _bearBoxesOB = array.new_box()
var box[] _bullBoxesOB = array.new_box()
var box[] _bearBoxesFVG = array.new_box()
var box[] _bullBoxesFVG = array.new_box()
var box[] _bearBoxesRJB = array.new_box()
var box[] _bullBoxesRJB = array.new_box()
var box[] _bearBoxesBOS = array.new_box()
var box[] _bullBoxesBOS = array.new_box()
//Functions
isUp(index) =>
close[index] > open[index]
isDown(index) =>
close[index] < open[index]
isObUp(index) =>
isDown(index + 1) and isUp(index) and close[index] > high[index + 1]
isObDown(index) =>
isUp(index + 1) and isDown(index) and close[index] < low[index + 1]
isFvgUp(index) =>
(low[index] > high[index + 2])
isFvgDown(index) =>
(high[index] < low[index + 2])
//Function to Calculte Box Length
_controlBox(_boxes, _high, _low, _type) =>
if array.size(_boxes) > 0
for i = array.size(_boxes) – 1 to 0 by 1
_box = array.get(_boxes, i)
_boxLow = box.get_bottom(_box)
_boxHigh = box.get_top(_box)
_boxRight = box.get_right(_box)
if bosBoxFlag and _type == _bos
if na or (bar_index + bosBoxLength – 1 == _boxRight and not((_high > _boxLow and _low < _boxLow) or (_high > _boxHigh and _low < _boxHigh)))
box.set_right(_box, bar_index + bosBoxLength – 1)
else if (filterMitOB and _type == _ob) or (filterMitFVG and _type == _fvg) or (filterMitRJB and _type == _rjb)
if na or (bar_index == _boxRight and not((_high > _boxLow and _low < _boxLow) or (_high > _boxHigh and _low < _boxHigh)))
box.set_right(_box, bar_index + 1)
else
if _type == _ob
box.set_bgcolor(_box, mitOBColor)
box.set_border_color(_box, mitOBColor)
else if _type == _fvg
box.set_bgcolor(_box, mitFVGColor)
box.set_border_color(_box, mitFVGColor)
else if _type == _rjb
box.set_bgcolor(_box, mitRJBColor)
box.set_border_color(_box, mitRJBColor)
else
if na or (bar_index == _boxRight and not((_high > _boxLow and _low < _boxLow) or (_high > _boxHigh and _low < _boxHigh)))
box.set_right(_box, bar_index + 1)
//////////////////// Pivots ////////////////////
hih = ta.pivothigh(high, pivotLookup, pivotLookup)
lol = ta.pivotlow(low , pivotLookup, pivotLookup)
top = ta.valuewhen(hih, high[pivotLookup], 0)
bottom = ta.valuewhen(lol, low [pivotLookup], 0)
plot(top, offset=-pivotLookup, linewidth=1, color=(top != top[1] ? na : (plotPVT ? pvtTopColor : na)), title=”Pivot Top”)
plot(bottom, offset=-pivotLookup, linewidth=1, color=(bottom != bottom[1] ? na : (plotPVT ? pvtBottomColor : na)), title=”Pivot Bottom”)
//////////////////// Order Block //////////////////
//Bullish OB Box Plotting
if isObUp(1) and plotOB
_bullboxOB = box.new(left=bar_index – 2, top=high[2], right=bar_index, bottom=math.min(low[2], low[1]), border_color=color.new(obBullColor, obBorderTransparency), border_style=obBoxBorder, border_width=1, bgcolor=obBullColor,
text=plotLabelOB ? _obLabel + _plus : _empty, text_halign=text.align_right, text_valign=text.align_bottom, text_size=obLabelSize, text_color=obLabelColor)
if array.size(_bullBoxesOB) > obMaxBoxSet
box.delete(array.shift(_bullBoxesOB))
array.push(_bullBoxesOB, _bullboxOB)
//Bearish OB Box Plotting
if isObDown(1) and plotOB
_bearboxOB = box.new(left=bar_index – 2, top=math.max(high[2], high[1]), right=bar_index, bottom=low[2], border_color=color.new(obBearColor, obBorderTransparency), border_style=obBoxBorder, border_width=1, bgcolor=obBearColor,
text=plotLabelOB ? _obLabel + _minus : _empty, text_halign=text.align_right, text_valign=text.align_bottom, text_size=obLabelSize, text_color=obLabelColor)
if array.size(_bearBoxesOB) > obMaxBoxSet
box.delete(array.shift(_bearBoxesOB))
array.push(_bearBoxesOB, _bearboxOB)
if plotOB
_controlBox(_bearBoxesOB, high, low, _ob)
_controlBox(_bullBoxesOB, high, low, _ob)
//////////////////// Fair Value Gap //////////////////
//Bullish FVG Box Plotting
if isFvgUp(0)
box _bullboxFVG = na
if plotStructureBreakingFVG and (close[1] > top) and (low[1] < top) and (high[2] < top) and (low > top)
_bullboxFVG := box.new(left=bar_index-2, top=low[0], right=bar_index, bottom=high[2], bgcolor=fvgStructBreakingColor, border_color=color.new(fvgStructBreakingColor, fvgBorderTransparency), border_style=fvgBoxBorder, border_width=1,
text=plotLabelFVG ? _fvgLabel + _plus : _empty, text_halign=text.align_right, text_valign=text.align_bottom, text_size=fvgLabelSize, text_color=fvgLabelColor)
else if plotFVG
_bullboxFVG := box.new(left=bar_index-2, top=low[0], right=bar_index, bottom=high[2], bgcolor=fvgBullColor, border_color=color.new(fvgBullColor, fvgBorderTransparency), border_style=fvgBoxBorder, border_width=1,
text=plotLabelFVG ? _fvgLabel + _plus : _empty, text_halign=text.align_right, text_valign=text.align_bottom, text_size=fvgLabelSize, text_color=fvgLabelColor)
if array.size(_bullBoxesFVG) > fvgMaxBoxSet
box.delete(array.shift(_bullBoxesFVG))
array.push(_bullBoxesFVG, _bullboxFVG)
//Bearish FVG Box Plotting
if isFvgDown(0)
box _bearboxFVG = na
if plotStructureBreakingFVG and (close[1] < bottom) and (high[1] > bottom) and (low[2] > bottom) and (high < bottom)
_bearboxFVG := box.new(left=bar_index-2, top=low[2], right=bar_index, bottom=high[0], bgcolor=fvgStructBreakingColor, border_color=color.new(fvgStructBreakingColor, fvgBorderTransparency), border_style=fvgBoxBorder, border_width=1,
text=plotLabelFVG ? _fvgLabel + _minus : _empty, text_halign=text.align_right, text_valign=text.align_bottom, text_size=fvgLabelSize, text_color=fvgLabelColor)
else if plotFVG
_bearboxFVG := box.new(left=bar_index-2, top=low[2], right=bar_index, bottom=high[0], bgcolor=fvgBearColor, border_color=color.new(fvgBearColor, fvgBorderTransparency), border_style=fvgBoxBorder, border_width=1,
text=plotLabelFVG ? _fvgLabel + _minus : _empty, text_halign=text.align_right, text_valign=text.align_bottom, text_size=fvgLabelSize, text_color=fvgLabelColor)
if array.size(_bearBoxesFVG) > fvgMaxBoxSet
box.delete(array.shift(_bearBoxesFVG))
array.push(_bearBoxesFVG, _bearboxFVG)
if plotFVG or plotStructureBreakingFVG
_controlBox(_bearBoxesFVG, high, low, _fvg)
_controlBox(_bullBoxesFVG, high, low, _fvg)
//////////////////// Rejection Block //////////////////
if plotRJB
isDownRjbObCondition = isObDown(1)
isDownRjb1 = isDownRjbObCondition and (high[1] < (close[2] + 0.2*(high[2]-close[2]))) // RJB is on trapped’s wick and <50% of the wick was covered by signal
isDownRjb2 = isDownRjbObCondition and (high[1] > high[2]) // RJB is on signal’s wick
if isDownRjb1 and plotRJB
_bearboxRJB = box.new(left=bar_index-2, top=high[2], right=bar_index, bottom=close[2], bgcolor=rjbBearColor, border_color=color.new(rjbBearColor, rjbBorderTransparency), border_style=rjbBoxBorder, border_width=1,
text=plotLabelRJB ? _rjbLabel + _minus : _empty, text_halign=text.align_right, text_valign=text.align_bottom, text_size=rjbLabelSize, text_color=rjbLabelColor)
if array.size(_bearBoxesRJB) > rjbMaxBoxSet
box.delete(array.shift(_bearBoxesRJB))
array.push(_bearBoxesRJB, _bearboxRJB)
if isDownRjb2 and plotRJB
_bearboxRJB = box.new(left=bar_index-1, top=high[1], right=bar_index, bottom=open[1], bgcolor=rjbBearColor, border_color=color.new(rjbBearColor, rjbBorderTransparency), border_style=rjbBoxBorder, border_width=1,
text=plotLabelRJB ? _rjbLabel + _minus : _empty, text_halign=text.align_right, text_valign=text.align_bottom, text_size=rjbLabelSize, text_color=rjbLabelColor)
if array.size(_bearBoxesRJB) > rjbMaxBoxSet
box.delete(array.shift(_bearBoxesRJB))
array.push(_bearBoxesRJB, _bearboxRJB)
//Bullish RJB Box Plotting
if plotRJB
isUpRjbObCondition = isObUp(1)
isUpRjb1 = isUpRjbObCondition and (low[1] > (close[2] – 0.2*(close[2]-low[2]))) // RJB is on trapped’s wick and <50% of the wick was covered by signal
isUpRjb2 = isUpRjbObCondition and (low[1] < low[2]) // RJB is on signal’s wick
if isUpRjb1 and plotRJB
_bullboxRJB = box.new(left=bar_index-2, top=close[2], right=bar_index, bottom=low[2], bgcolor=rjbBullColor, border_color=color.new(rjbBullColor, rjbBorderTransparency), border_style=rjbBoxBorder, border_width=1,
text=plotLabelRJB ? _rjbLabel + _plus : _empty, text_halign=text.align_right, text_valign=text.align_bottom, text_size=rjbLabelSize, text_color=rjbLabelColor)
if array.size(_bullBoxesRJB) > rjbMaxBoxSet
box.delete(array.shift(_bullBoxesRJB))
array.push(_bullBoxesRJB, _bullboxRJB)
if isUpRjb2 and plotRJB
_bullboxRJB = box.new(left=bar_index-1, top=open[1], right=bar_index, bottom=low[1], bgcolor=rjbBullColor, border_color=color.new(rjbBullColor, rjbBorderTransparency), border_style=rjbBoxBorder, border_width=1,
text=plotLabelRJB ? _rjbLabel + _plus : _empty, text_halign=text.align_right, text_valign=text.align_bottom, text_size=rjbLabelSize, text_color=rjbLabelColor)
if array.size(_bullBoxesRJB) > rjbMaxBoxSet
box.delete(array.shift(_bullBoxesRJB))
array.push(_bullBoxesRJB, _bullboxRJB)
if plotRJB
_controlBox(_bearBoxesRJB, high, low, _rjb)
_controlBox(_bullBoxesRJB, high, low, _rjb)
//////////////////// Crossovers a.k.a. Break of Structure ////////////////////
//Bullish BOS Box Plotting
if plotBOS
if ta.crossover(useHighLowForBullishBoS ? high : close, top)
_bullboxBOS = box.new(left=bar_index, top=top, right=bosBoxFlag ? bar_index+bosBoxLength : bar_index+1, bottom=bottom, bgcolor=bosBullColor, border_color=color.new(bosBullColor, bosBorderTransparency), border_style=bosBoxBorder, border_width=1,
text=plotLabelBOS ? _bosLabel + _plus : _empty, text_halign=text.align_right, text_valign=text.align_bottom, text_size=bosLabelSize, text_color=bosLabelColor)
if array.size(_bullBoxesBOS) > bosMaxBoxSet
box.delete(array.shift(_bullBoxesBOS))
array.push(_bullBoxesBOS, _bullboxBOS)
//Bearish BOS Box Plotting
if plotBOS
if ta.crossunder(useHighLowForBearishBoS ? low : close, bottom)
_bearboxBOS = box.new(left=bar_index, top=top, right=bosBoxFlag ? bar_index+bosBoxLength : bar_index+1, bottom=bottom, bgcolor=bosBearColor, border_color=color.new(bosBearColor, bosBorderTransparency), border_style=bosBoxBorder, border_width=1,
text=plotLabelBOS ? _bosLabel + _minus : _empty, text_halign=text.align_right, text_valign=text.align_bottom, text_size=bosLabelSize, text_color=bosLabelColor)
if array.size(_bearBoxesBOS) > bosMaxBoxSet
box.delete(array.shift(_bearBoxesBOS))
array.push(_bearBoxesBOS, _bearboxBOS)
if plotBOS
_controlBox(_bearBoxesBOS, high, low, _bos)
_controlBox(_bullBoxesBOS, high, low, _bos)
//////////////////// Premium Premium & Discount Discount //////////////////
premiumPremium = plotPPDD and isObDown(0) and ((math.max(high, high[1]) > top and close < top) or (math.max(high, high[1]) > top[1] and close < top[1]))
discountDiscount = plotPPDD and isObUp(0) and ((math.min(low, low[1]) < bottom and close > bottom) or (math.min(low, low[1]) < bottom[1] and close > bottom[1]))
plotshape(premiumPremium, “Bearish PPDD OB”, style=shape.triangledown , location=location.abovebar, color=ppddBearColor, size=size.tiny)
plotshape(discountDiscount, “Bullish PPDD OB”, style=shape.triangleup , location=location.belowbar, color=ppddBullColor, size=size.tiny)
premiumPremium1 = plotPPDD and (isUp(1) and isDown(0) and close[0] < open[1]) and ((math.max(high, high[1]) > top and close < top) or (math.max(high, high[1]) > top[1] and close < top[1])) and not premiumPremium
discountDiscount1 = plotPPDD and (isDown(1) and isUp(0) and close[0] > open[1]) and ((math.min(low, low[1]) < bottom and close > bottom) or (math.min(low, low[1]) < bottom[1] and close > bottom[1])) and not discountDiscount
plotshape(premiumPremium1, “Bearish PPDD Weak OB”, style=shape.xcross, location=location.abovebar, color=ppddBearColor, size=size.tiny)
plotshape(discountDiscount1, “Bullish PPDD Weak OB”, style=shape.xcross, location=location.belowbar, color=ppddBullColor, size=size.tiny)
////////////////// High Volume Bars //////////////////
volEma = ta.ema(volume, hvbEMAPeriod)
isHighVolume = volume > (hvbMultiplier * volEma)
barcolor(plotHVB and isUp(0) and isHighVolume ? hvbBullColor : na, title=”Bullish HVB”)
barcolor(plotHVB and isDown(0) and isHighVolume ? hvbBearColor : na, title=”Bearish HVB”)
///////////////// Stacked OB + FVG //////////////////
plotshape(plotOBFVG and isFvgDown(0) and isObDown(1), “Bearish OB+FVG Stack”, style=shape.diamond, location=location.abovebar, color=obfvgBearColor, size=size.tiny)
plotshape(plotOBFVG and isFvgUp(0) and isObUp(1), “Bullish OB+FVG Stack”, style=shape.diamond, location=location.belowbar, color=obfvgBullColor, size=size.tiny)
Bonsoir Nicolas, est ce possible d avoir les blocks (order/mitigation/vacuum…) sur l indicateur aussi? j avais aussi une petite question a propos de cet indicateur… https://www.prorealcode.com/prorealtime-indicators/higher-time-frame-heikin-ashi-candles-on-a-lower-time-frame-chart/ Merci bcp
Je n’ai aucune idée de quoi il s’agit pour ce type de blocks, mais pourquoi pas. Il faudrait pour cela définir leurs conditions logiques pour qu’ils puissent être programmés. Merci d’ouvrir un sujet spécifique sur le forum des indicateurs.
Bonsoir Nicolas, peut on ajouter des PDF ici? J ai un PDF de huddleston ou il explique le systeme de blocks, ça fait longtemps que je l ai, il faudrait le rechercher online, je ne le trouve qu a scribd https://es.scribd.com/document/535619191/1-5127678218228203863 il y a aussi un link a reddit https://www.reddit.com/r/InnerCircleTraders/comments/13luror/does_anybody_know_where_to_find_these_ict/ Merci
le code de xtian en haut, a plusieurs de blocks, rejection, mitigation… je vais chercher de l info, mais ca me prendra quelques jours… merci en tout cas
Hello Nicolas I really like this indicator, but unfortunately it keeps drawing huge gaps from Friday’s closing price to Sunday night’s opening. These disturb me all day in the chart. How can I filter these out?
Bonjour Nicolas, je voulais savoir si vous aviez des competences en programation NT8 ? Car j’aimerais bcp avoir ce code pour NT8 ? Bon journée.
hello Nicolas! i want to get in touch with you. I have my own strategy and my own indicators in pinescript. I need to get my strategy coded and would like to get a quote from you. Please respond on how i can get in contact with you.