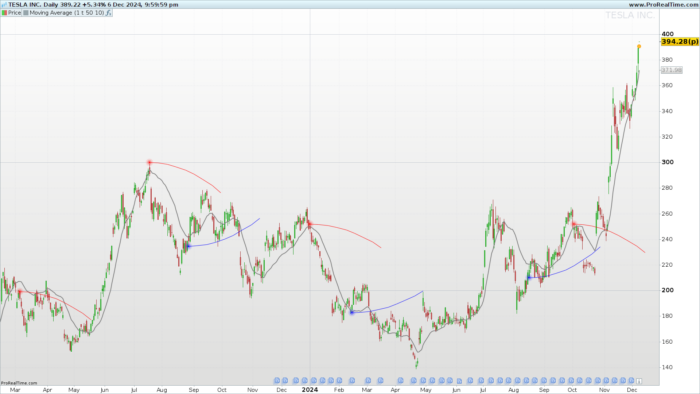
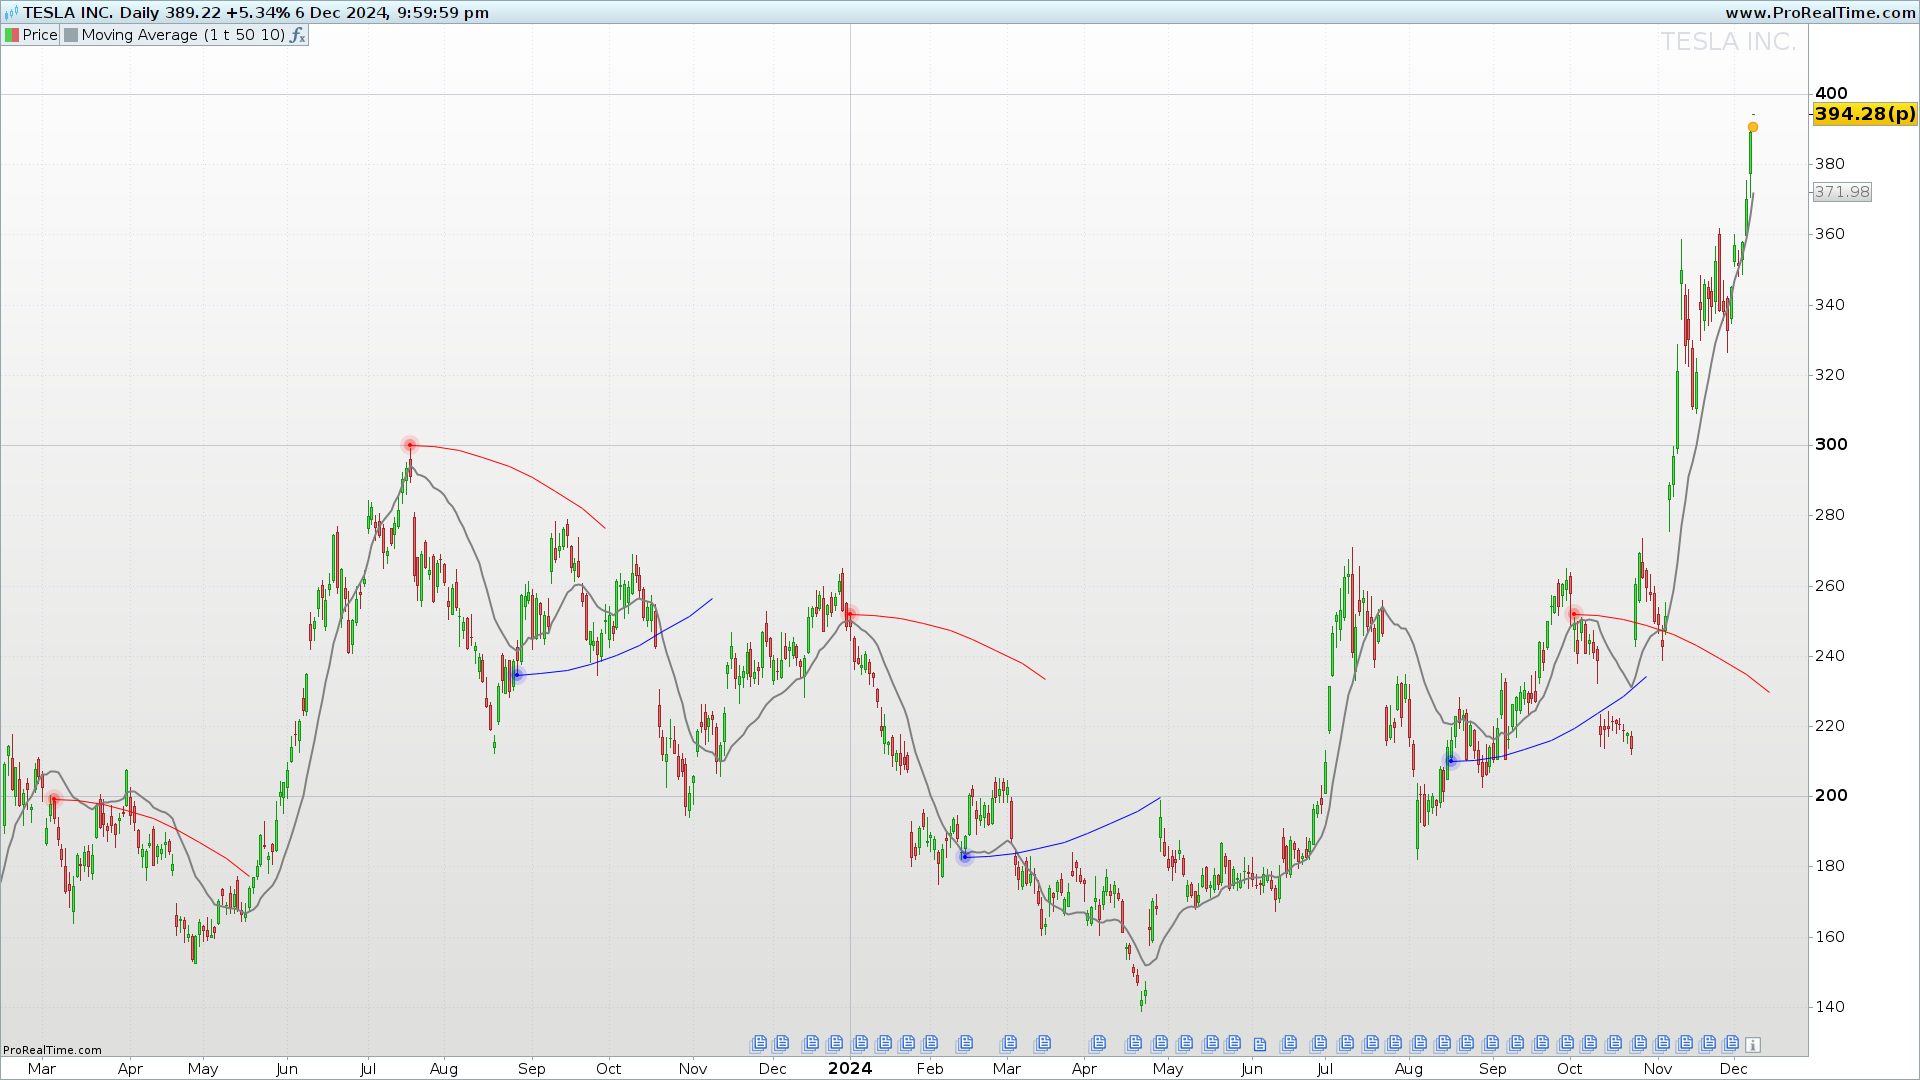
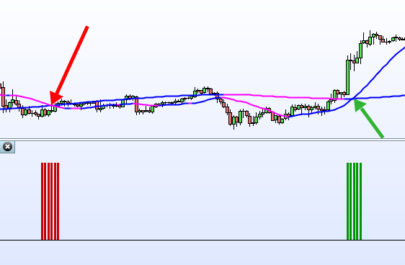
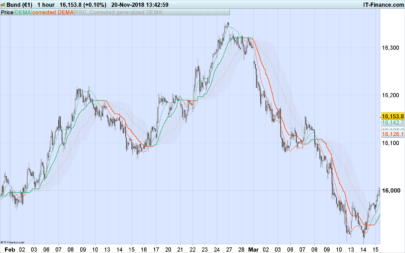
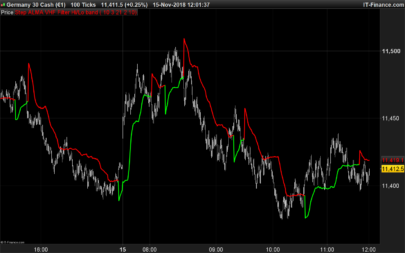
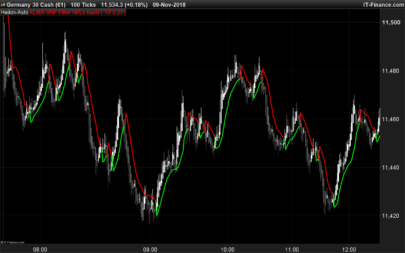
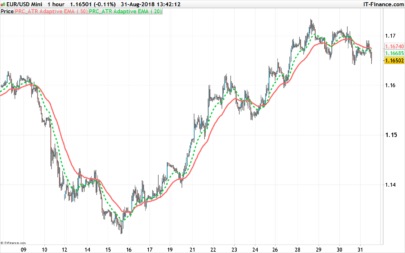
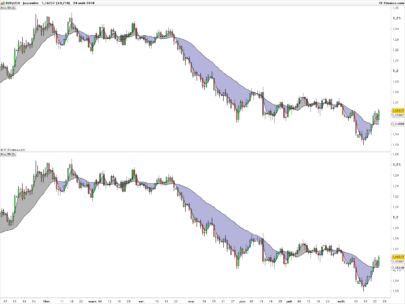
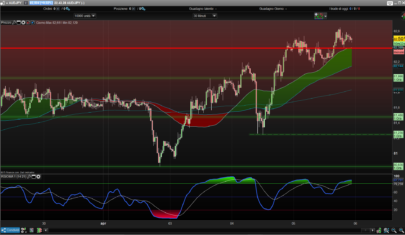
The MA Sabres indicator is designed to identify potential trend reversals based on the behavior of a moving average (MA). It leverages visual cues to mark key areas on the chart, making it easier for traders to spot opportunities and manage trades effectively.
Purpose of MA Sabres
- Detect Trend Reversals:
- The indicator tracks a selected moving average (e.g., TEMA or another MA type) and identifies moments when:
- The trend shifts after maintaining a consistent direction for a specified number of bars.
- Areas of potential reversals are highlighted on the chart.
- The indicator tracks a selected moving average (e.g., TEMA or another MA type) and identifies moments when:
- Visual Representation:
- It plots dynamic “sabres” that act as visual markers of trend change zones.
- The “sabres” are curved lines created by connecting multiple points, representing the anticipated reversal region.
- Customizable Parameters:
- Choose the type of moving average and adjust its length.
- Configure the sensitivity of trend detection using customizable settings.
Key Parameters
len: The length of the moving average (default: 50).count: The minimum number of consecutive bars required to confirm a trend direction.UseTEMA: Toggle between TEMA or other MA types.MaType: Specify the type of moving average when not using TEMA.
How it Works
- Calculate the Moving Average:
- Based on the configuration, it uses either a TEMA or a selected MA to track price movements.
- Detect Trend Behavior:
- Identifies when the MA reaches a local extreme or starts changing direction.
- Tracks upward (rising) and downward (falling) trends using historical data.
- Draw “Sabres”:
- When a reversal is detected, the indicator calculates a series of points to create a parabola-like shape.
- These points are plotted as curved segments on the chart to mark potential trend change zones.
How to Use MA Sabres
- Configure the Indicator:
- Choose between TEMA or other moving averages and set the
lenparameter for your desired timeframe.
- Choose between TEMA or other moving averages and set the
- Monitor Trend Reversals:
- Observe the chart for “sabres” marking potential reversal points.
- Adapt and Customize:
- Modify the sensitivity (
count) and type of moving average to suit different market conditions.
- Modify the sensitivity (
Conclusion:
The MA Sabres indicator provides a unique way to visualize trend reversals with dynamic visual markers. It is a versatile tool for both novice and experienced traders to gain insights into market movements and optimize their trading strategies.
|
1 2 3 4 5 6 7 8 9 10 11 12 13 14 15 16 17 18 19 20 21 22 23 24 25 26 27 28 29 30 31 32 33 34 35 36 37 38 39 40 41 42 43 44 45 46 47 48 49 50 51 52 53 54 55 56 57 58 59 60 61 62 63 64 65 66 67 68 69 70 71 72 73 74 75 76 77 78 79 80 81 82 83 84 85 86 87 88 89 90 91 92 93 94 95 96 97 98 99 100 101 102 103 104 105 106 107 108 109 110 111 112 113 114 115 116 117 118 119 120 121 122 123 124 125 126 127 128 |
//-------------------------------------// //PRC_MA Sabres //version = 0 //09.12.2024 //Iván González @ www.prorealcode.com //Sharing ProRealTime knowledge //-------------------------------------// // Inputs //-------------------------------------// len=50 count=20 UseTEMA=1 MaType=2 //-------------------------------------// //Method MA //-------------------------------------// if UseTEMA then ma=tema[len](close) else ma=average[len,MaType](close) endif //-------------------------------------// //Calculations //-------------------------------------// // MA falling if ma<=lowest[count](ma) then fl=1 else fl=0 endif up=fl[1] and ma>ma[1] // MA rising if ma>=highest[count](ma) then rs=1 else rs=0 endif dn=rs[1] and ma<ma[1] //ATR calculation atr=averagetruerange[14](close) n=barindex //-------------------------------------// //Calculations //-------------------------------------// if up and summation[len](up)=1 then // Puntos fijos xx1 = n-1 xx9 = n+len yy1 = low[1] - atr / 15 yy9 = low[1] + atr * 2 // Calcular los puntos intermedios en X (división uniforme) xx2 = xx1 + (xx9 - xx1) * 1 / 8 xx3 = xx1 + (xx9 - xx1) * 2 / 8 xx4 = xx1 + (xx9 - xx1) * 3 / 8 xx5 = xx1 + (xx9 - xx1) * 4 / 8 xx6 = xx1 + (xx9 - xx1) * 5 / 8 xx7 = xx1 + (xx9 - xx1) * 6 / 8 xx8 = xx1 + (xx9 - xx1) * 7 / 8 // Ecuación cuadrática para Y (emular parábola) aa = (yy9 - yy1) / pow((xx9 - xx1), 2) // Calcular el coeficiente de la parábola yy2 = yy1 + aa * pow((xx2 - xx1), 2) yy3 = yy1 + aa * pow((xx3 - xx1), 2) yy4 = yy1 + aa * pow((xx4 - xx1), 2) yy5 = yy1 + aa * pow((xx5 - xx1), 2) yy6 = yy1 + aa * pow((xx6 - xx1), 2) yy7 = yy1 + aa * pow((xx7 - xx1), 2) yy8 = yy1 + aa * pow((xx8 - xx1), 2) // Dibujar segmentos drawsegment(xx1,yy1,xx2,yy2)coloured("blue") drawsegment(xx3,yy3,xx2,yy2)coloured("blue") drawsegment(xx3,yy3,xx4,yy4)coloured("blue") drawsegment(xx5,yy5,xx4,yy4)coloured("blue") drawsegment(xx5,yy5,xx6,yy6)coloured("blue") drawsegment(xx7,yy7,xx6,yy6)coloured("blue") drawsegment(xx7,yy7,xx8,yy8)coloured("blue") drawsegment(xx9,yy9,xx8,yy8)coloured("blue") //DrawPoints drawpoint(xx1,yy1,1)coloured("blue") drawpoint(xx1,yy1,3)coloured("blue",70) drawpoint(xx1,yy1,5)coloured("blue",30) endif if dn and summation[len](dn) = 1 then // Puntos fijos x1 = n-1 x9 = n+len y1 = high[1] + atr / 15 y9 = high[1] - atr * 2 // Calcular los puntos intermedios en X (división uniforme) x2 = x1 + (x9 - x1) * 1 / 8 x3 = x1 + (x9 - x1) * 2 / 8 x4 = x1 + (x9 - x1) * 3 / 8 x5 = x1 + (x9 - x1) * 4 / 8 x6 = x1 + (x9 - x1) * 5 / 8 x7 = x1 + (x9 - x1) * 6 / 8 x8 = x1 + (x9 - x1) * 7 / 8 // Ecuación cuadrática para Y (emular parábola) a = (y9 - y1) / pow((x9 - x1), 2) // Calcular el coeficiente de la parábola y2 = y1 + a * pow((x2 - x1), 2) y3 = y1 + a * pow((x3 - x1), 2) y4 = y1 + a * pow((x4 - x1), 2) y5 = y1 + a * pow((x5 - x1), 2) y6 = y1 + a * pow((x6 - x1), 2) y7 = y1 + a * pow((x7 - x1), 2) y8 = y1 + a * pow((x8 - x1), 2) // Dibujar segmentos drawsegment(x1,y1,x2,y2)coloured("red") drawsegment(x3,y3,x2,y2)coloured("red") drawsegment(x3,y3,x4,y4)coloured("red") drawsegment(x5,y5,x4,y4)coloured("red") drawsegment(x5,y5,x6,y6)coloured("red") drawsegment(x7,y7,x6,y6)coloured("red") drawsegment(x7,y7,x8,y8)coloured("red") drawsegment(x9,y9,x8,y8)coloured("red") //DrawPoints drawpoint(x1,y1,1)coloured("red") drawpoint(x1,y1,3)coloured("red",70) drawpoint(x1,y1,5)coloured("red",30) endif return ma as "Moving Average" coloured("Grey")style(line,2) |
Share this
No information on this site is investment advice or a solicitation to buy or sell any financial instrument. Past performance is not indicative of future results. Trading may expose you to risk of loss greater than your deposits and is only suitable for experienced investors who have sufficient financial means to bear such risk.
ProRealTime ITF files and other attachments :
Find other exclusive trading pro-tools on ![]()
PRC is also on YouTube, subscribe to our channel for exclusive content and tutorials


Parece muy util. Gracias
de nada!
Ivan, riesci a creare un indicatore per le “evolventi paraboliche” ? grazie
Impagable tu trabajo cada semana. ¡Gracias!
de nada! 🙂