Here’s a method to graphically display the signal status for a group of indicators as well as an algorithm for generating a consensus indicator that shows when these indicators are in sync. (by Norm North).
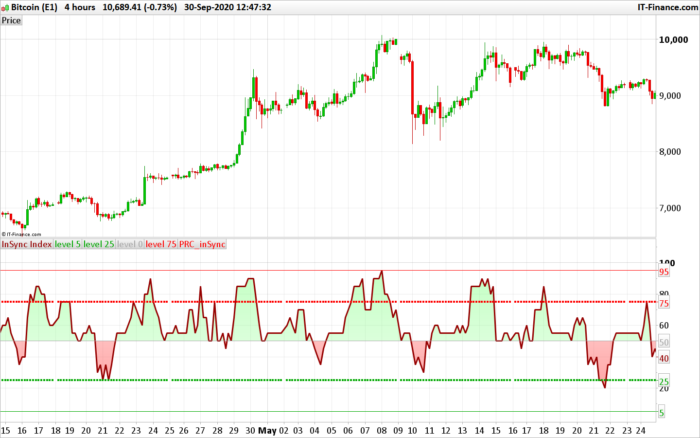
The below indicator compiled trend conditions on many indicators, such as the Bollinger Bands, RSI, CCI, Ease Of Movement, MACD, Money Flow Index, ROC and Stochastic. Each conditions gain a score of +5 or -5 (depending of the direction) and therefore give a global indicator with a score between 5 and 95.
5 is extremely bearish, while 95 is extremely bullish. Converted from a Metastock code following a request in the italian forum.
|
1 2 3 4 5 6 7 8 9 10 11 12 13 14 15 16 17 18 19 20 21 22 23 24 25 26 27 28 29 30 31 32 33 34 35 36 37 38 39 40 41 42 43 44 45 46 47 48 49 50 51 52 53 54 55 56 57 58 59 60 61 62 63 64 65 66 67 68 69 70 71 72 73 74 75 76 77 78 79 80 81 82 83 84 85 86 87 88 89 90 91 92 93 94 95 96 97 98 99 100 101 102 103 104 105 106 107 108 109 110 111 112 113 114 115 116 117 118 119 120 121 122 123 124 125 126 127 128 129 130 131 132 133 134 135 136 137 138 139 140 141 142 143 144 145 146 147 148 149 150 151 152 153 154 155 156 157 158 159 |
bolinslb = BollingerDown[20](close) BOLInSUB= BollingerUp[20](close) BOLInS2 = (close - BOLInSLB ) / (BOLInSUB- BOLInSLB) //BOLInSLL if bolins2<.05 then bolinsll=-5 elsif bolins2>.95 then bolinsll=5 else bolinsll=0 endif //CCIInS if cci[14]>100 then cciins=5 elsif cci[14]<-100 then cciins=-5 else cciins=0 endif EMVInS2 = EaseOfMovement[10]-average[10](EaseOfMovement[10]) //EMVInSB if emvins2<0 then if average[10](EaseOfMovement[10])<0 then emvinsb = -5 else emvinsb=0 endif else emvinsb=0 endif //EMVInSS if emvins2>0 then if average[10](EaseOfMovement[10])>0 then emvinss=5 else emvinss=0 endif else emvinss=0 endif MACDInS2 = MACD[12,26,9](close)-average[10](MACD[12,26,9](close)) //MACDinSB if macdins2<0 then if average[10](MACD[12,26,9](close))<0 then macdinsb=-5 else macdinsb=0 endif else macdinsb=0 endif //MACDInSS If MACDInS2 > 0 then if average[10](MACD[12,26,9](close))>0 then macdinss=5 else macdinss=0 endif else macdinss=0 endif //MFIInS if MoneyFlowIndex[20]>80 then mfiins=5 elsif MoneyFlowIndex[20]<20 then mfiins=-5 else mfiins=0 endif PDOInS2 = DPO[18] - average[10](DPO[18]) //PDOInSB if pdoins2<0 then if average[10](DPO[18])<0 then pdoinsb=-5 else pdoinsb=0 endif else pdoinsb=0 endif //PDOInSS if pdoins2>0 then if average[10](DPO[18])>0 then pdoinss=5 else pdoinss=0 endif else pdoinss=0 endif ROCInS2 = ROC[10](close) - average[10](ROC[10](close)) //ROCInSB if rocins2<0 then if average[10](ROC[10](close))<0 then rocinsb=-5 else rocinsb=0 endif else rocinsb=0 endif //ROCInSS Index if rocins2>0 then if average[10](ROC[10](close))>0 then rocinss=5 else rocinss=0 endif else rocinss=0 endif //RSIInS If( RSI[14]> 70) then rsiins=5 elsIf( RSI[14]< 30) then rsiins=-5 else rsiins=0 endif //STO%dInS if Stochastic[14,3](close)>80 then stodins=5 elsif Stochastic[14,3](close)<20 then stodins=-5 else stodins=0 endif //STO%kInS if Stochastic[14,1](close)>80 then stokins=5 elsif Stochastic[14,1](close)<20 then stokins=-5 else stokins=0 endif InSync=50 + CCIInS+ BOLInSLL+ RSIInS+ STOkInS+ STOdInS+ MFIInS+ EMVInSB+ EMVInSS+ ROCInSS+ ROCInSB+ PDOInSS[10]+ PDOInSB[10]+ MACDInSS+ MACDInSB return insync coloured(150,0,0) style(line,3) as "InSync Index", 5 coloured(0,168,0) as "level 5", 25 coloured(0,168,0) style(point,4) as "level 25", 50 coloured(168,168,168) as "level 0", 75 coloured(255,0,0) style(point,4) as "level 75", 95 coloured(255,0,0) |
Share this
No information on this site is investment advice or a solicitation to buy or sell any financial instrument. Past performance is not indicative of future results. Trading may expose you to risk of loss greater than your deposits and is only suitable for experienced investors who have sufficient financial means to bear such risk.
ProRealTime ITF files and other attachments :PRC is also on YouTube, subscribe to our channel for exclusive content and tutorials

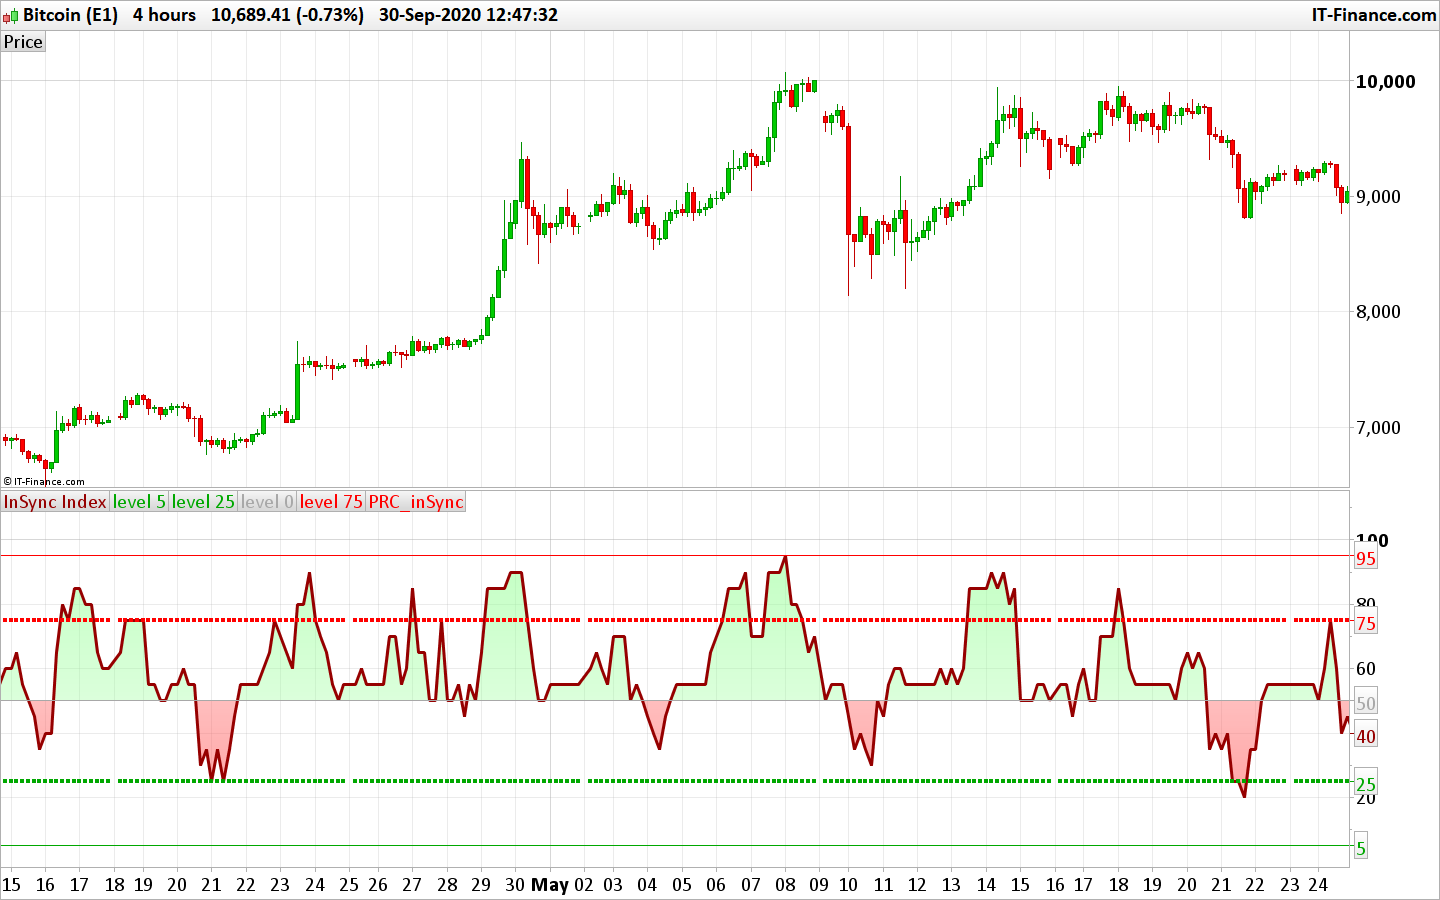


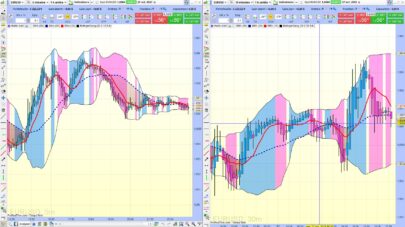


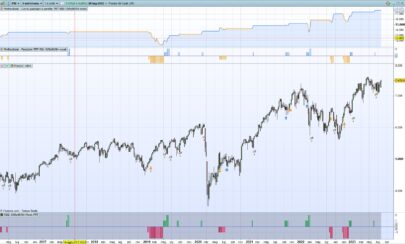
Possible interpretation: Indicator tags 80 = Start of bullish trend, tags 20 = Start of bearish trend
Bonjour,
Ajout de as “level 95” en toute fin de code. 😉
Hi Juanj. I am new to ProrealTime and I am trying to program the Proscreener. I want the Proscreener to be able to scan a certain class of assets and find certain conditions. Can you assist me in how to program it?
Bonjour.
Votre code a l’air efficace. Sauriez-vous comment modifier les étiquettes qui s’affichent sur le graphique svp ? Mon problème est que j’ai les étiquettes avec les indices “inSync 95” et “level 5” qui s’affichent, alors que j’aimerais afficher l’ “InSync Index” . Merci.
Il faut simplement modifier ces textes à convenance, dans la dernière ligne de code (les textes sont entre guillemets).
Je viens de comprendre l’origine de mon problème : le graphique n’avait tout simplement pas assez de place sur mon écran pour afficher toutes les étiquettes, et l’ “Insync Index” ne s’affichait pas. Tout bête.
Merci Nicolas, le problème était donc autre.
Sorry but the stochastic part should be different:
sto=Stochastic[14,1]
stod=average[3](sto)
//STO%dInS
if stod>80 then
stodins=5
elsif stod80 then
stokins=5
elsif sto<20 then
stokins=-5
else
stokins=0
endif
Bonjour à la communauté serait il possible d’avoir un scanner qui ramène les actions en journalier lorsque la ligne d’index est inférieure à la valeur 25? je n’arrive pas avec la création simplifiée de prorealtime . En espérant une réponse
Merci d’ouvrir un sujet dans le forum des screeners en respectant les règles de publication svp 🙂
Bravo Nicolas !
Tu es en quelque sorte l’inventeur de Metascore…(oups je viens de lire jusqu’au bout et cela vient d’une demande d’un forum italien)
J’y avais pensé mais impossible de savoir comment traduire la chose …
C’est génial on va pouvoir réaliser notre propre « metascore « d’après cette base et en retirant « extratrend « qui pèse « lourd « dans metascore au point de le rendre asymétrique mais je comprends => beaucoup de stratégie et de programme automatique ne prennent que des longs…pas de shorts
Une question => Pourquoi ?
Merci pour toutes ces idées
Arnaud
Dans un but d’investissement pure, et non spéculatif.